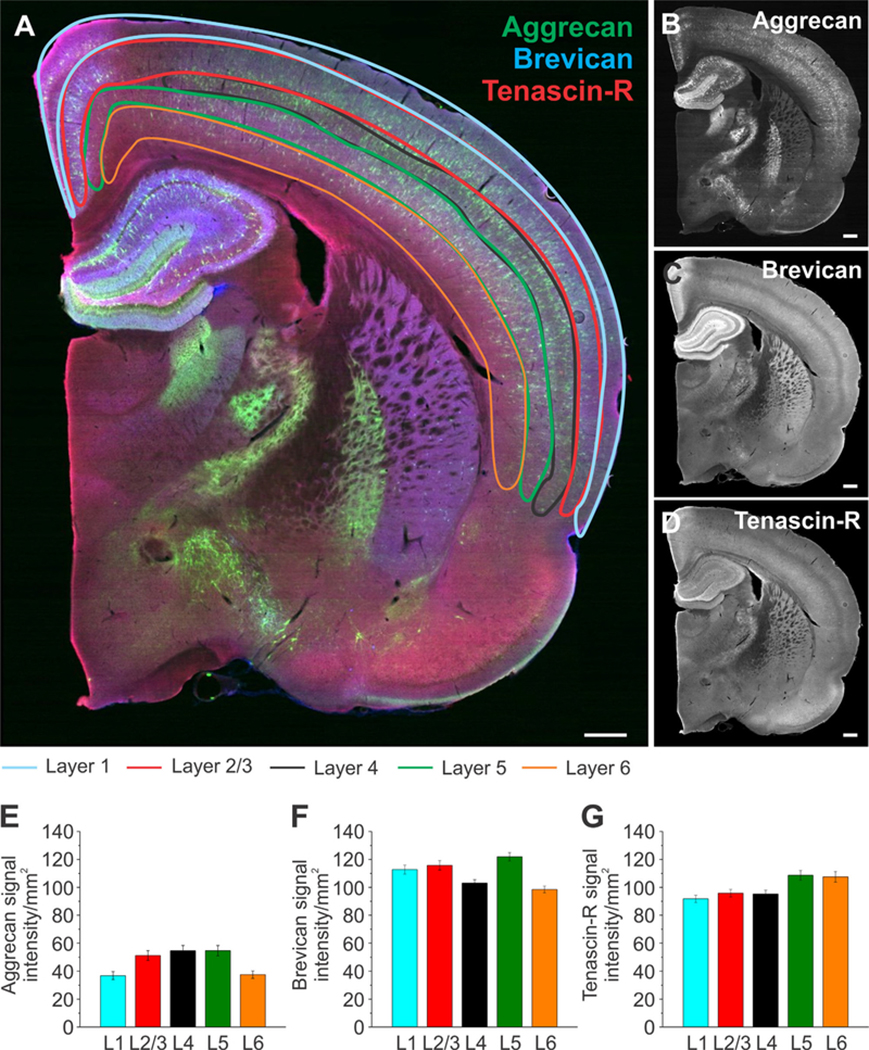
Figure 7.
Extracellular matrix distribution in distinct isocortical layers. A: Whole brain slices were labeled for aggrecan (green), brevican (blue), and tenascin-R (red) with outlined subregions of the isocortex: layer 1 (blue), layer 2/3 (red), layer 4 (black), layer 5 (green), and layer 6 (orange). B–D: Single channels for each protein are shown in black and white. E–G: Signal intensity measurements for aggrecan (E), brevican (F), and tenascin-R (G) for the subregions outlined in A. Column color corresponds to the region outline color in A. Error bars are shown as standard error of the mean (SEM). Significance levels calculated by ANOVA (Bonferroni post hoc test) are shown in Table 2B. n = 33 slices, 3 brains. Abbreviation: L, layer. Scale bar = 500 μm in A–D.

