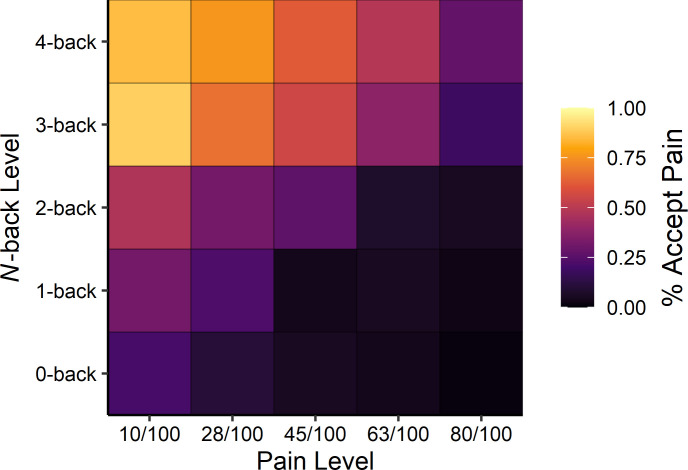
Figure 2. Averaged heatmap of choice behaviour across participants as a function of pain stimulus level (horizontal axis) and N-back level (vertical axis) on offer (see Supplementary file 1C for model estimates).
Lighter colours indicate a higher percentage of accepting the painful stimulus.

