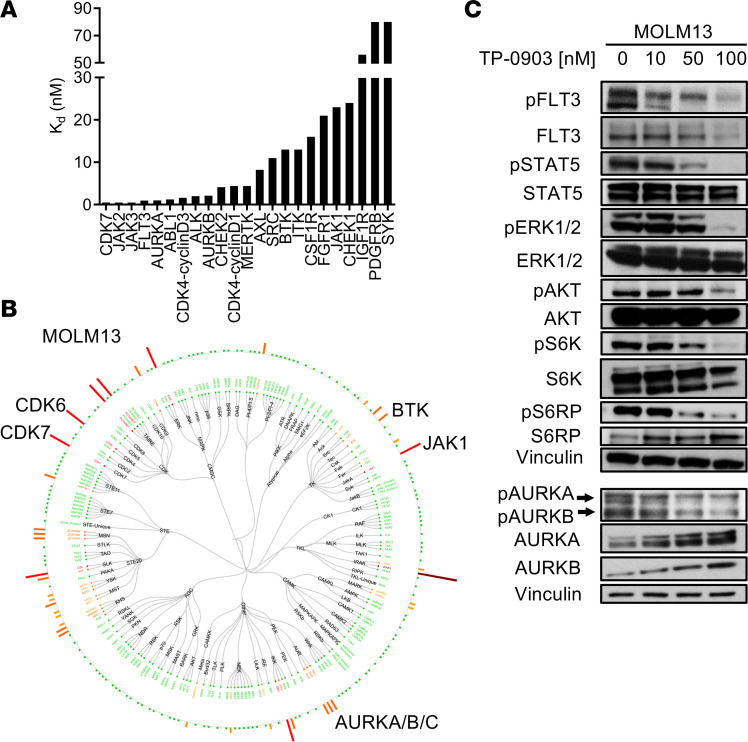
Figure 1. Kinase inhibition profile of TP-0903.
(A) Inhibition of a panel of kinases by TP-0903 in a KdELECT assay. KD (inhibitor binding constant) represented in nM. (B) Dendogram of native kinase inhibition in MOLM13 cells treated with 100 nM TP-0903 for 2 hours in a KiNativ assay. All kinases detected are shown and grouped based on classification. Inhibition is relative to the DMSO control indicated with a spectrum of dark red (>90%), red (75%–90%), orange (50–75%), yellow (35%–50%), and green (no change) bars. (C) Signaling inhibition in MOLM13 cells treated with DMSO or increasing concentrations of TP-0903 for 4 hours. Western blot analysis was performed on whole-cell lysates run on parallel gels with the indicated antibodies. A loading control was included with each gel, and a representative blot is shown; the top Vinculin blot served as a loading control for pERK1/2, and the bottom Vinculin blot served as a loading control for pAURKA/B. Data are representative of 2–3 independent experiments.

