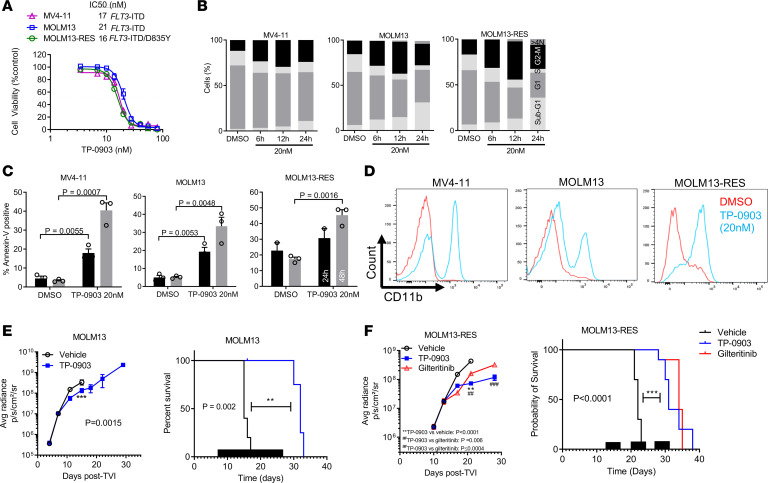
Figure 2. TP-0903 is active in FLT3-mutated AML.
(A) Activity of TP-0903 in FLT3-mutated AML cell lines (MTT assay, 72 hours, n = 18). The IC50 and mutations present in each cell line are listed. (B and C) Quantification of cell cycle phase (B) and mean (± SEM) annexin-V–positive cells (C) at the designated treatment times with TP-0903 (20 nM; n = 3). (D) Cell differentiation measured by expression of CD11b after treatment with TP-0903 (20 nM) for 72 hours. (E and F) Bioluminescence signal (mean ± SEM) (left panels) and survival (Kaplan-Meier analysis) (right panels) following treatment with TP-0903 (60 mg/kg), gilteritinib (30 mg/kg), or vehicle in MOLM13-Luc+ (n = 5/cohort) and MOLM13-RES-Luc+ (n = 10/cohort) NSG mouse xenograft models. Black bars depict treatment days. P values were determined using either unpaired 2-tailed Student’s t test (C and E), 1-way ANOVA (P < 0.0001; F) with Tukey multiple comparison test or log rank test (F; survival curve). Specific P values are indicated within the figure.

