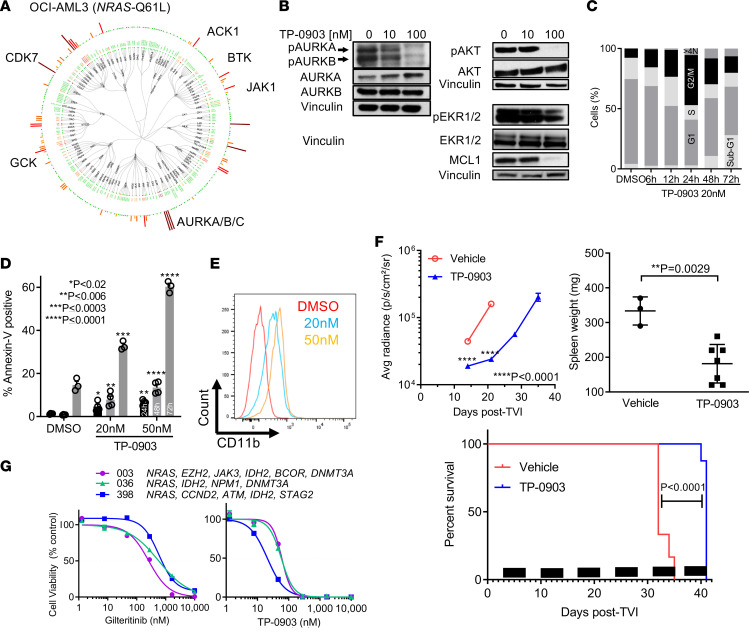
Figure 6. TP-0903 is active in AML with RAS pathway mutations.
(A) Dendogram of native kinase inhibition in OCI-AML3 cells treated with 100 nM TP-0903 for 2 hours in a KiNativ assay. All kinases detected are shown and grouped based on classification. Inhibition is relative to the DMSO control indicated on a spectrum of dark red (>90%), red (75%–90%), orange (50%–75%), yellow (35%–50%), and green (no change) bars. (B) Signaling inhibition of OCI-AML3 cells treated with DMSO or increasing concentrations of TP-0903 for 4 hours. Western blot analysis was performed on whole-cell lysates run on parallel gels with the indicated antibodies and is representative of 2 independent experiments. (C and D) Quantification of cell cycle phase (C) and mean (± SEM) annexin-V–positive cells (D) at the designated treatment times with TP-0903 (20 nM) or TP-0903 (50 nM) (n = 3). (E) Cell differentiation measured by expression of CD11b after treatment with TP-0903 (20 nM and 50 nM) for 72 hours (representative images). (F) Bioluminescence signal (mean ±SEM) and survival (Kaplan-Meier analysis) and spleen weight at study end following treatment with TP-0903 (50 mg/kg) once daily (n = 6) or vehicle (n = 8) in an OCI-AML3–Luc+ NSG mouse xenograft model. Black bars depict treatment days. (G) Inhibition of viability of human primary AML samples with indicated mutations treated with indicated TKI (CellTiterGlo, 72 hours, n = 3). P values were determined using either unpaired 2-tailed Student’s t test (F), 1 way ANOVA (P < 0.002; D) with Dunnett’s multiple comparison test, or log rank test (F; survival curve). Specific P values are indicated within the figure.

