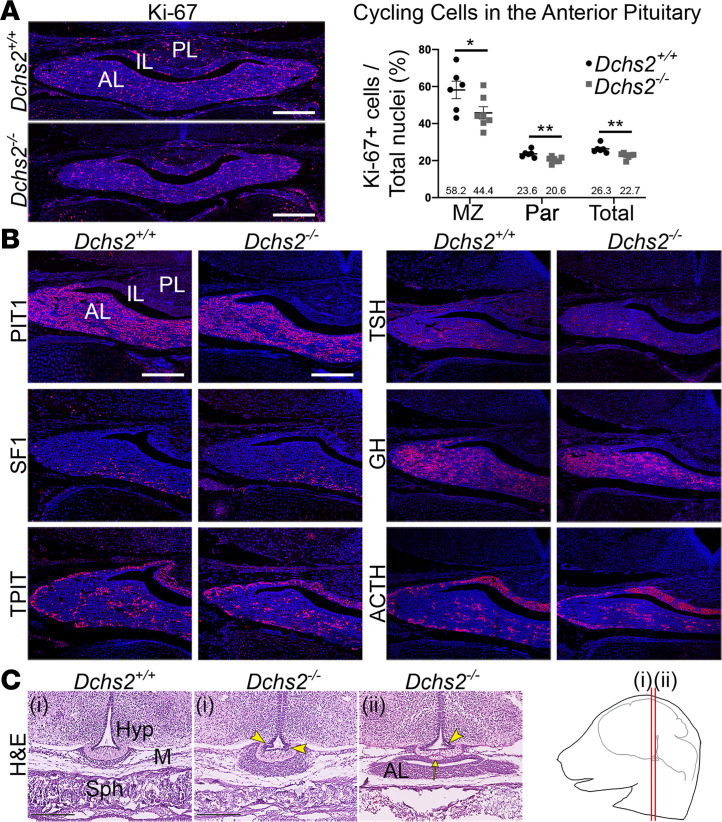
Figure 3. DCHS2 is required for normal murine pituitary development.
(A) Immunofluorescence staining using antibodies against Ki-67 to detect cycling cells, on frontal sections of pituitaries from Dchs2–/– mutants and WT littermate controls at 18.5 dpc. Graph depicting quantification of cycling cells of the anterior pituitary of WT controls and Dchs2–/– mutants, showing reduced proliferation in mutants in the marginal zone (MZ) surrounding the cleft P = 0.0495, parenchyme (Par) P = 0.007, and total throughout the anterior lobe P = 0.0044, unpaired Student’s t test (n = 3 per genotype, multiple sections counted). Values of Ki-67–positive cells are expressed as a percentage of the total nuclei in the anterior lobe. Average values are indicated. *P < 0.05; **P < 0.01. (B) Immunofluorescence staining on Dchs2–/– pituitaries and littermate controls at 18.5 dpc (n = 3) using antibodies against lineage-committed progenitor markers PIT1 (thyrotrophs, somatotrophs, lactotrophs), SF1 (gonadotrophs), and TPIT (corticotrophs, melanotrophs) and hormones TSH, GH, and ACTH expressed in differentiated thyrotrophs, somatotrophs, and corticotrophs, respectively. Staining is comparable for all markers between genotypes. (C) Hematoxylin and eosin staining on frontal sections of Dchs2–/– mutants and controls at 18.5 dpc at axial levels as indicated in the cartoon (n = 6). Abnormal invaginations are seen in the median eminence (arrowheads) as well as lobulated protrusions (arrow). PL, posterior lobe; IL, intermediate lobe; AL, anterior lobe; Hyp, hypothalamus; M, mesenchyme; Sph, sphenoid bone. Scale bars: 200 μm (A and B), 250 μm (C).

