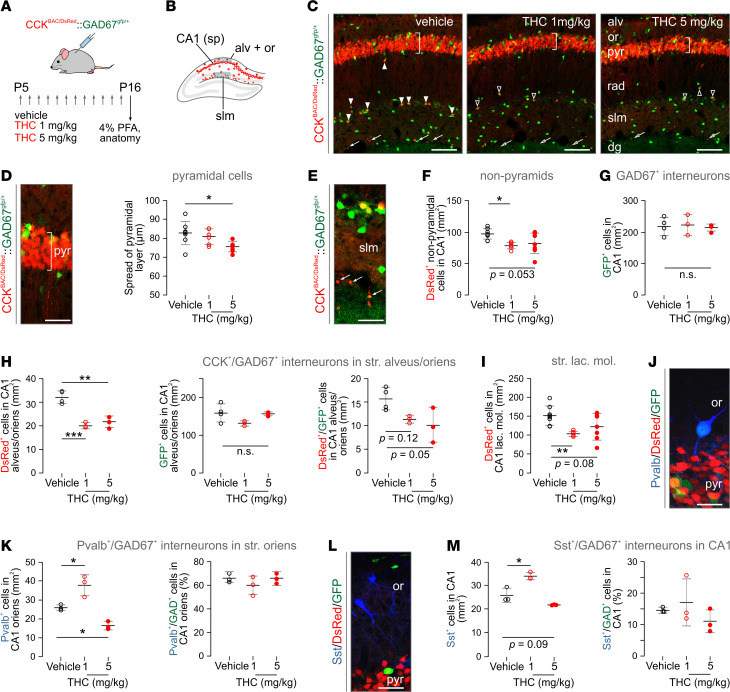
Figure 1. THC exposure during P5–P16 induces neurochemical deficits in CA1 hippocampal neurons.
(A) Experimental paradigm in CCKBAC/DsRed and CckBAC/DsRedGad1gfp/+ mice. Daily injections had an average volume of 100 μL, but final volume was adjusted to the individual body weight; n = 3–8 mice/genotype/treatment (n = 3–4 mice/treatment for CckBAC/DsRedGad1gfp/+ line). (B) Schematic outline of the dorsal hippocampus, with red circles denoting the localization of DsRed+ neurons. (C) Representative images from DsRed+/GFP+ hippocampi after vehicle or THC treatment. Vertical bar over the pyramidal layer shows the general approach to measure cell spread within. Solid arrowheads point to DsRed+/GFP+ interneurons in control, whereas open arrowheads denote residual cells upon THC exposure. Arrows point to small-diameter DsRed+ neurons at the deep stratum lacunosum moleculare (slm; see also Supplemental Figure 3A). (D) High-resolution image of pyramidal cells in hippocampal CA1, with vertical bar illustrating a vector to measure cell spread (left) with quantitative data (right). (E) DsRed+/GFP+ neurons in slm. Arrows point to small-diameter DsRed+ signal. (F and G) The density of DsRed+ (F) but not GFP+ neurons (G) significantly decreased in nonpyramidal layers of the CA1 subfield (qualifying as interneurons by location) after THC treatment. (H) Likewise, the density of DsRed+/GFP+ interneurons in strata alveus/oriens (but not of the GFP+ neuronal contingent) became significantly reduced upon THC treatment. (I) Similar changes were seen in stratum lacunosum moleculare. (J) Representative photomicrograph showing the distribution of Pvalb+/GFP+ interneurons in nonpyramidal CA1. (K) THC-induced dose-dependent changes in Pvalb+ interneuron density in stratum oriens. Note that THC treatment did not affect the probability of Pvalb and GFP colocalization. (L) Histochemical detection of Sst+ interneurons in the hippocampus. (M) THC induced dose-dependent changes in the density of but not the probability of colocalization with GFP for Sst+ interneurons. Cell counts were normalized to a surface area of 1 mm2. Data were expressed as mean ± SD; *P < 0.05, **P < 0.01, ***P < 0.001 (versus control; 1-way ANOVA followed by Bonferroni’s post hoc test). Scale bars: 120 μm (C), 25 μm (D and E), 10 μm (J and L). str., striatum; alv, str. alveus; dg, dentate gyrus; or, str. oriens; PFA, paraformaldehyde; pyr, str. pyramidale; rad, str. radiatum.

