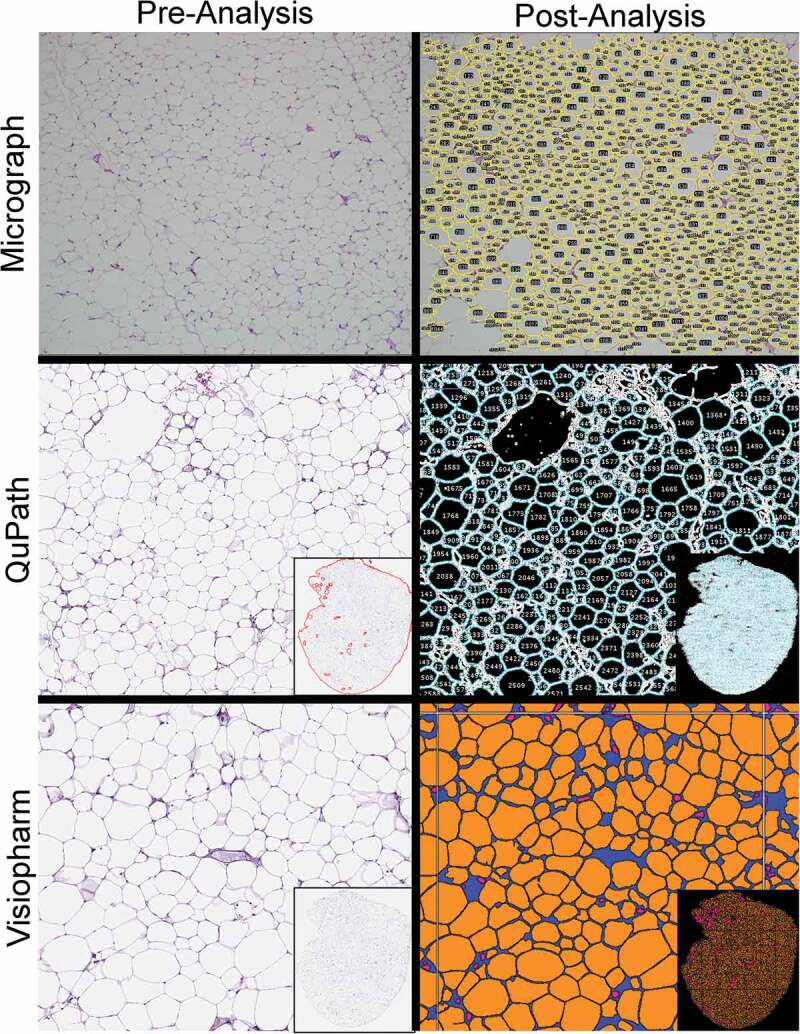
Figure 1.

Screenshots of adipocyte tissue images pre- and post-analysis
Each method successfully segmented adipocytes and calculated their areas, which are shown in yellow outlines (micrograph), blue outlines (QuPath), or as solid orange (Visiopharm). Magnification: Micrograph 4x, QuPath 5x, Visiopharm 5x. Insets: whole-slide subgross images when applicable.
