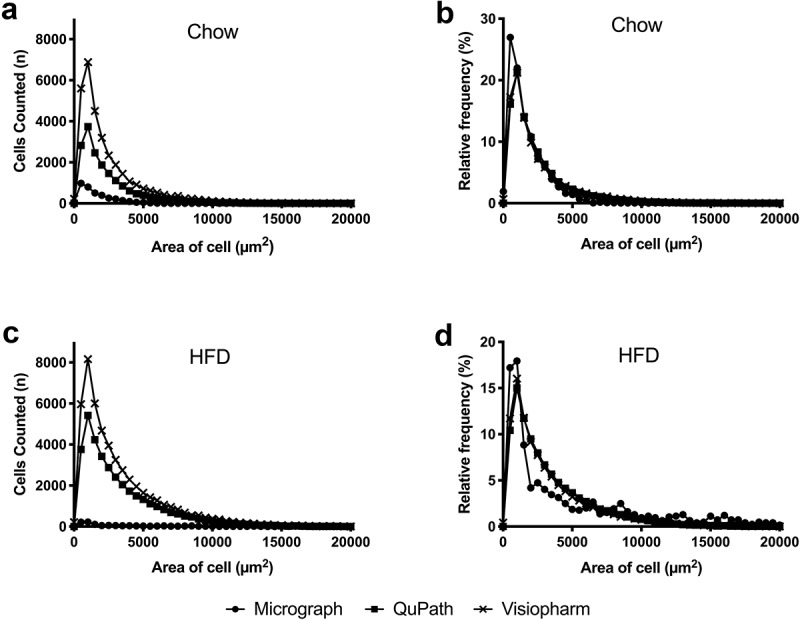
Figure 2.

Population-level representations of adipocyte size
Histograms with absolute numbers of adipocytes of a given size were sorted by area with bin size of 500 µm2 (a, c). Relative frequency plots: the number of counted cells of a given size per bin (size = 500 µm2) was normalized to the total number of cells counted per slide to generate a percentage (b, d). Slides from Chow-fed mice (n = 7) are shown in A and B, while slides from HFD-fed mice (n = 8) are shown in C and D.
