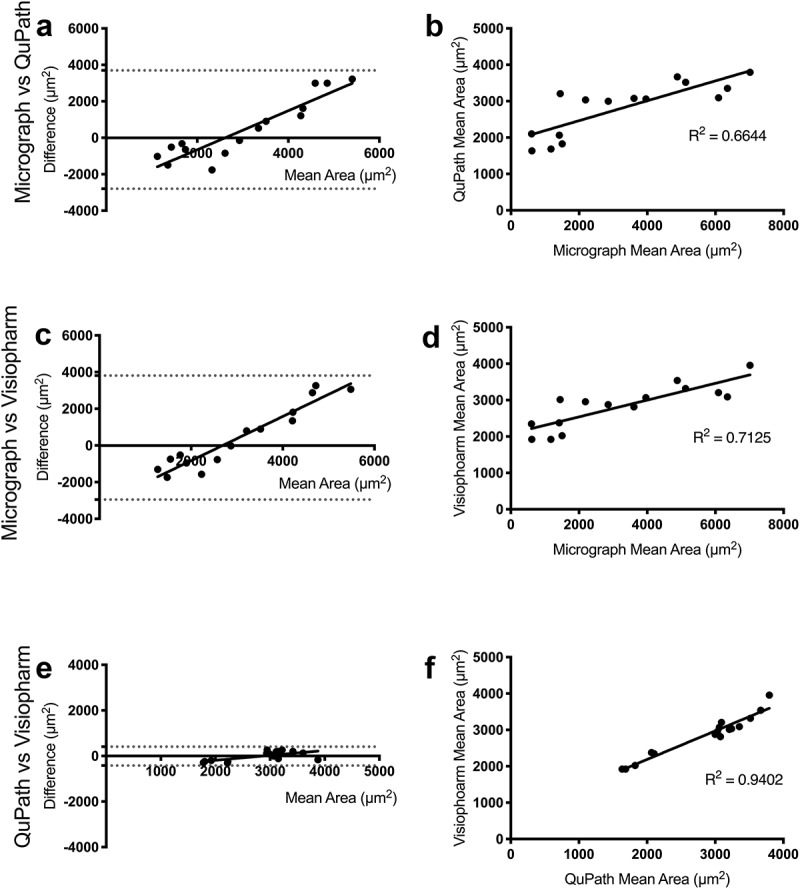
Figure 3.

Pairwise representations between image analysis methods
Bland-Altman plots of micrograph and QuPath (a), micrograph and Visiopharm (c) and QuPath and Visiopharm (e) emphasize the greater difference in method results between micrograph and whole-slide image analysis. Regression plots indicate a weak correlation between QuPath and micrograph methods (b), a weak but greater correlation between Visiopharm and micrograph methods (d) and a strong correlation between Visiopharm and QuPath, the two whole-slide image analysis methods (f).
