
Figure 3.
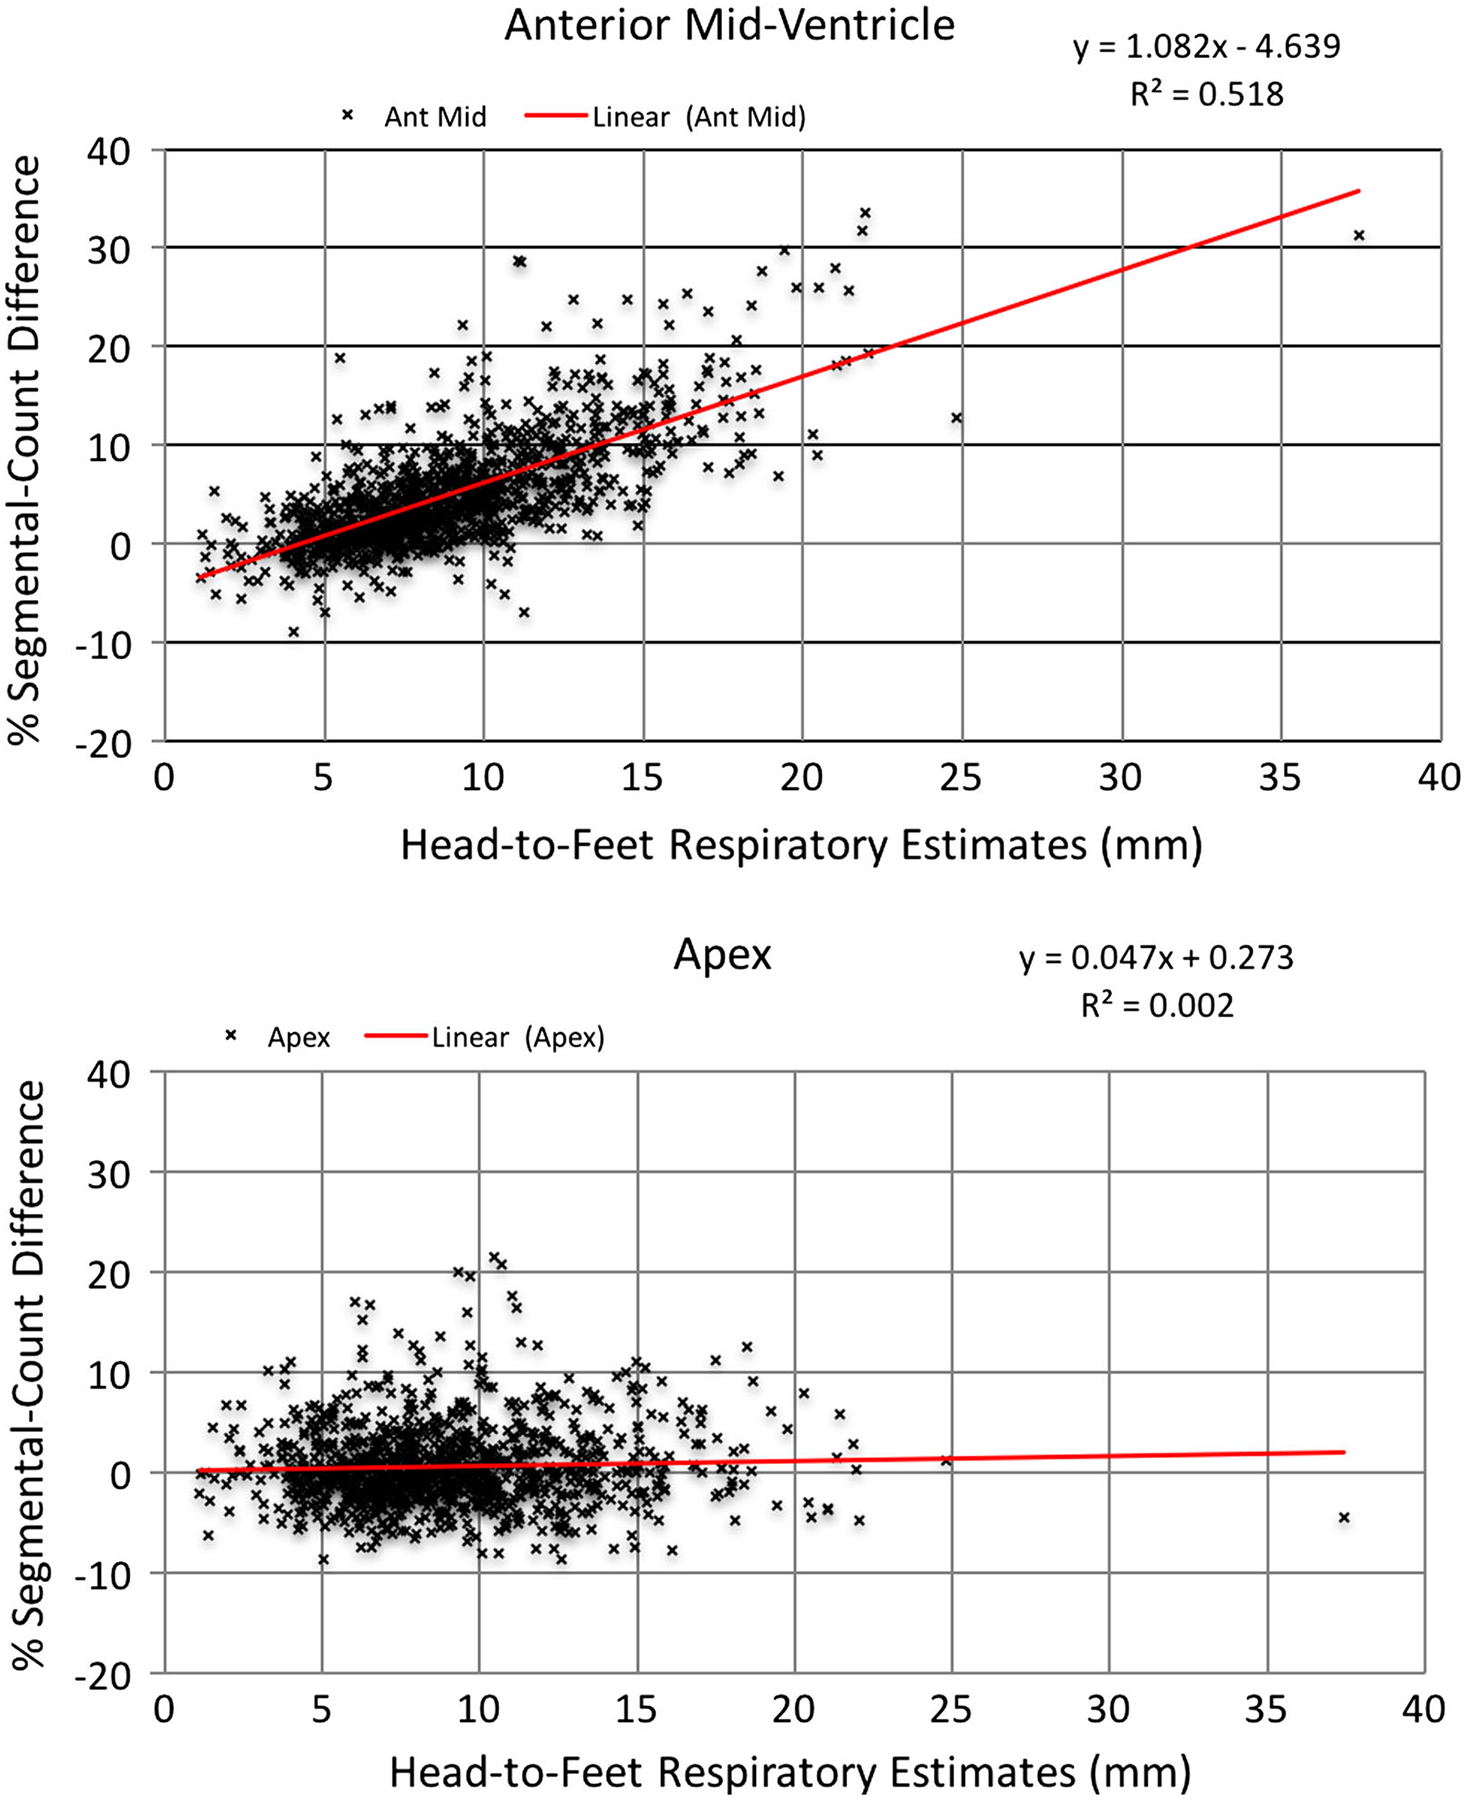
Graphs showing two extremes in slope from Table 4 as examples of the relationship between head-to-feet respiratory motion estimates and percent segmental-count differences (% Diff) with the anterior mid-ventricle segment at the top, and the apex segment of the patient polar maps at the bottom.