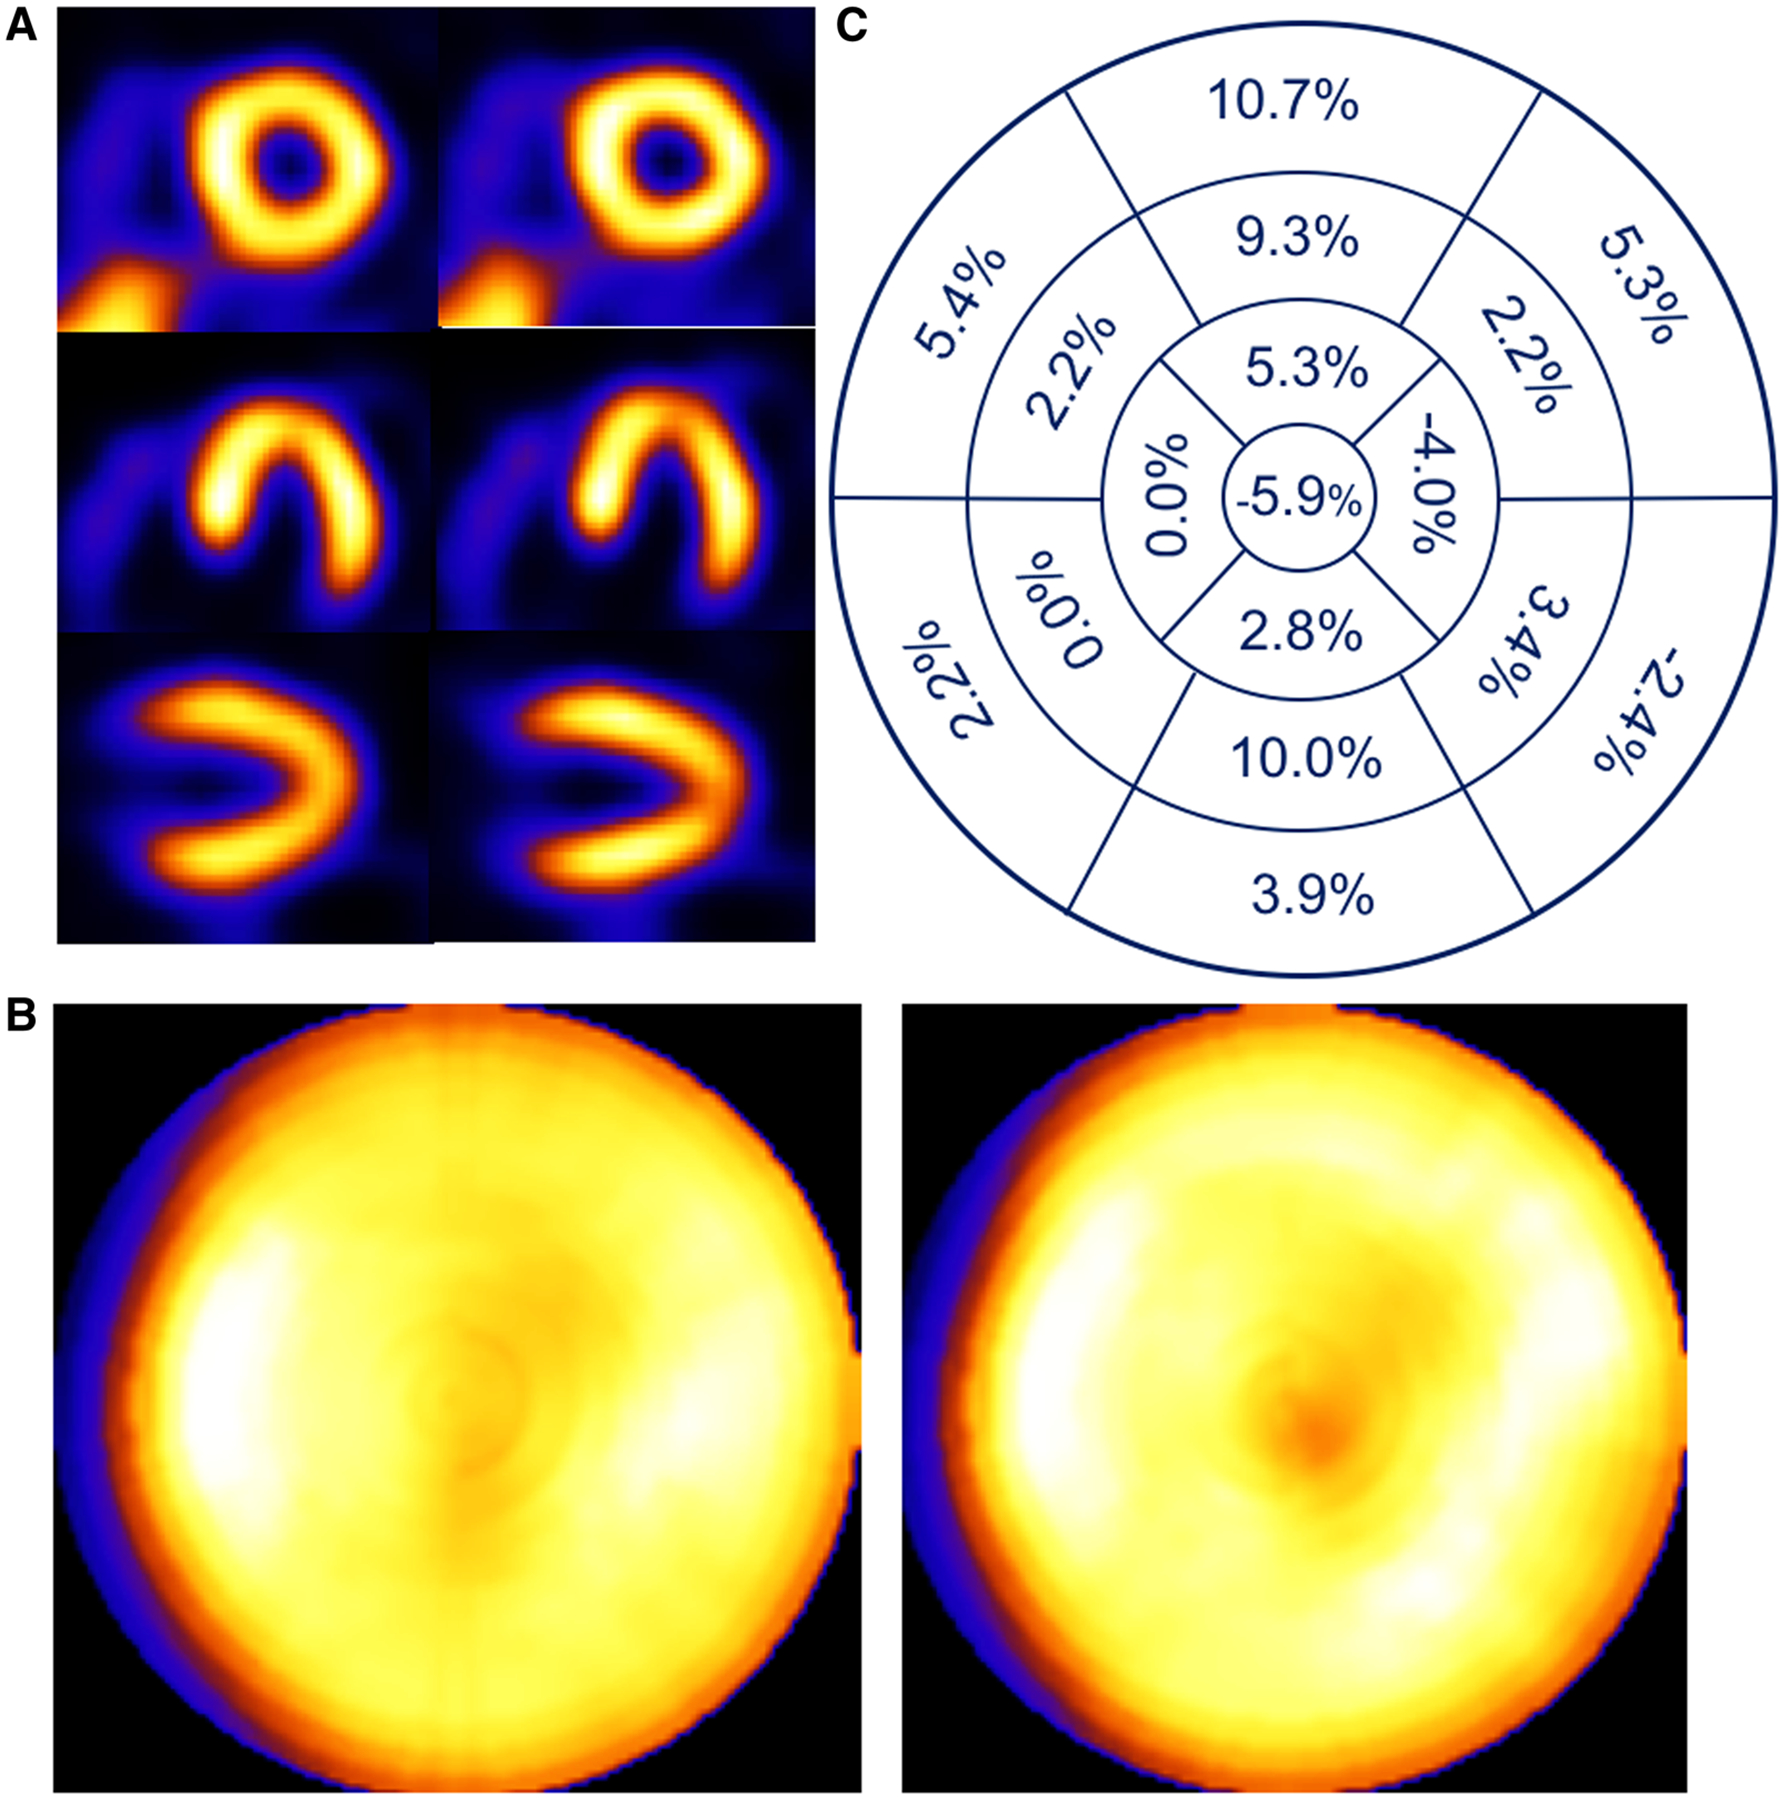
Figure 4.

Patient example of a 74-year-old female with a 13 mm head-to-feet respiratory motion estimate. Shown (A) are short-, horizontal long-, and vertical long-axis slices without (left) and with (right) respiratory compensation. Note improved visualization of apical thinning as an increased apical photopenic area with respiratory motion correction. (B) Comparison of polar maps generated from short-axis slices without (left) and with (right) respiratory motion compensation, each displayed to its own maximum, which shows a reduction in the variation between anterior and inferior versus lateral and septal walls with correction. (C) Presentation of the average % segmental-count differences between without and with respiratory motion compensation for the 17 polar map segments, which numerically confirms the greater increase in anterior and inferior versus lateral and septal walls with correction visualized in the polar map.
