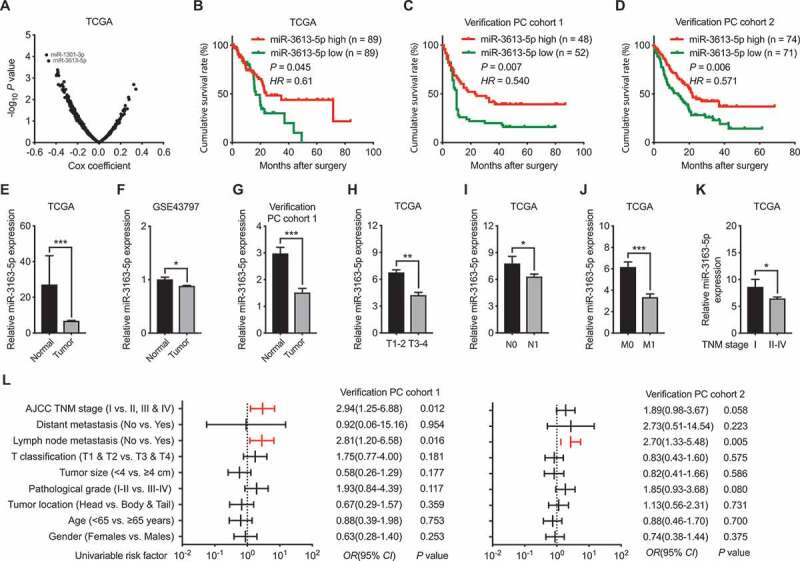
Figure 1.

Correlations between miR-3613-5p and the prognosis of PC patients. (a) The correlation between miRNAs (n = 2558) expression with the prognosis of PC patients were analyzed using data from TCGA database. Two miRNAs (miR-1301-3p and miR-3613-5p) with the highest associations were identified. (b) Cumulative survival rate of PC patients from TCGA database analyzed according to the expression level of miR-3613-5p. (c-d) Cumulative survival rates of patients from our PC cohort 1 (c) and cohort 2 (d) with higher or lower miR-3613-5p expression (e-f) Relative miR-3613-5p expression in PC samples as compared with normal controls as analyzed using data from TCGA (e) and GSE43797 (f). (g). Reduced miR-3613-5p expression PC tumors as compared with normal control tissues in our PC cohort1. (h-k) miR-3613-5p expression level in PC samples from TCGA database as classified by T1-T2/T3-T4 (h), N0/N1 (i), M0/M1 (j), and TNM Ⅰ/TNM Ⅱ-Ⅳ (k). (l) Comparison of the TNM stages, lymph node metastasis, T classification, tumor size, tumor differentiation, tumor location, age and gender among the two PC cohorts according to the expression levels of miR-3613-5p. Bar, SEM. * P< 0.05, ** P< 0.01, *** P< 0.001; Student’s t test
