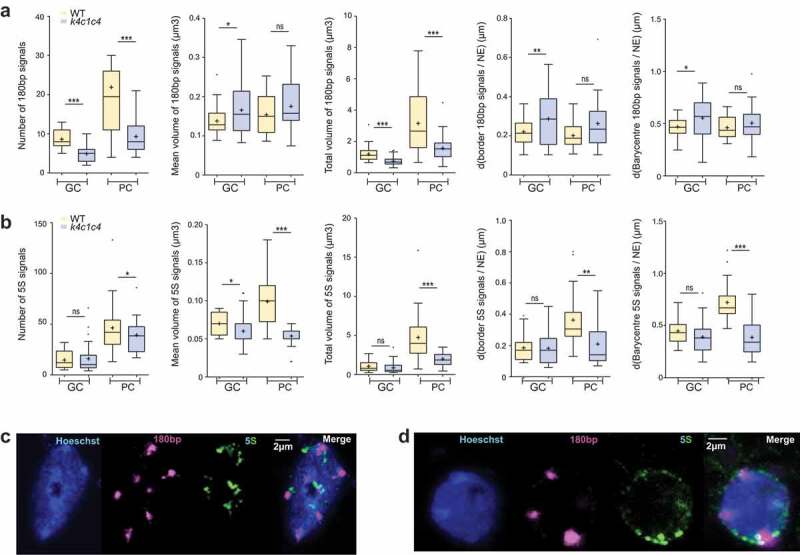
Figure 5.

Analysis of aspect and position of 180pb and 5S rDNA repeats revealed by 3D-DNA FISH using NucleusJ 2.0
NucleusJ 2.0 parameters applied to A) 180bp signals and B) 5S rDNA. Parameters: number of DNA FISH signals, mean volume of FISH signal (µm3), total volume of FISH signal (µm3), distance between FISH signal border and the nuclear envelope (d(FISH signal Border/NE), µm) and distance between FISH signal barycenter and the nuclear envelope (d(Barycenter of FISH signal/NE), µm) (Supplemental tables 7–8). Student t-test P-value: ns >0.01, * <0.01, ** <0.001 and *** <0.0001. C) Typical 3D DNA FISH Z-projection of pavement cell nuclei of WT (n = 65 for 180bp and n = 32 for 5S) and D) k4c1c4 mutant (n = 95 for 180bp and n = 48 for 5S) (Supplemental tables 7–8). From left to right: Hoechst (DNA, blue), 5ʹ TYE 563 LNA probe (180bp, purple), CY5 PCR probe (5S, green) and merge. Scale Bar 2 µm.
