
Figure 2.
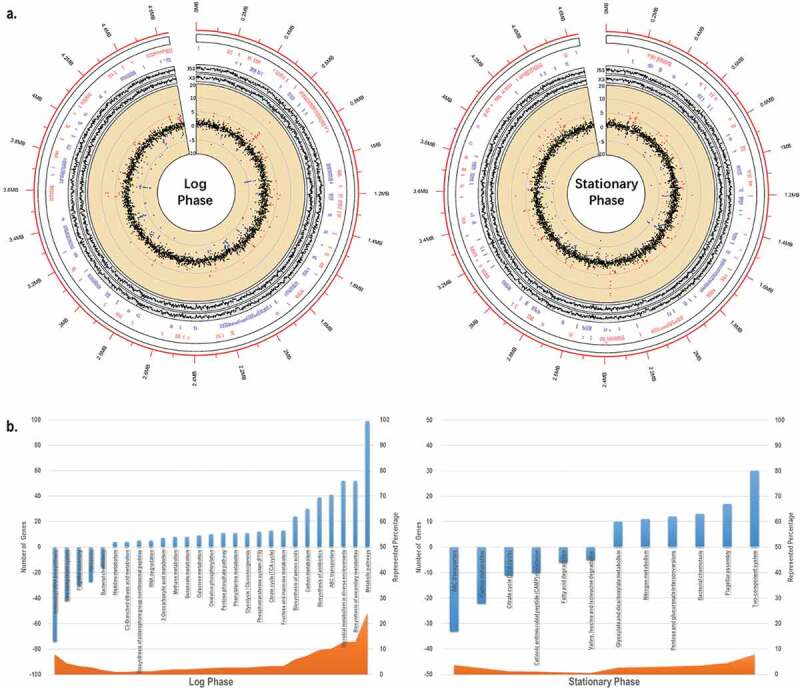
In silico analysis of E. coli J53/pNDM-HN380 at log and stationary phases. (a). Transcriptome analysis. The outermost circle (red) represents the genome coordinates (in Mbp) of J53. The first inner circle represents the names of genes of J53/pNDM-HN380 with fold-change greater than 2 folds (in red) and −2 folds (in blue) and the locations of genes in the genome. The second inner circle represents gene expression of J53 (J53) and J53/pNDM-HN380 (X3) in TPM (transcripts per million) in log2 scale. The third inner circle represents the change of gene expression in J53/pNDM-HN380 compared with J53, in a log2 scale. The red and blue dots represent upregulated and downregulated genes (>2-fold) respectively, and others are coloured in black. (b). KEGG enrichment pathway analysis. Columns in blue represent the number of genes with log2-fold change greater than 1 in the pathway. Area in orange represents the percentage of the number of genes with log2-fold change greater than 1 annotation under the pathway. Positive numbers represent the number of upregulated genes in the pathway whereas negative numbers represent the number of downregulated genes in the pathway