
Figure 3.
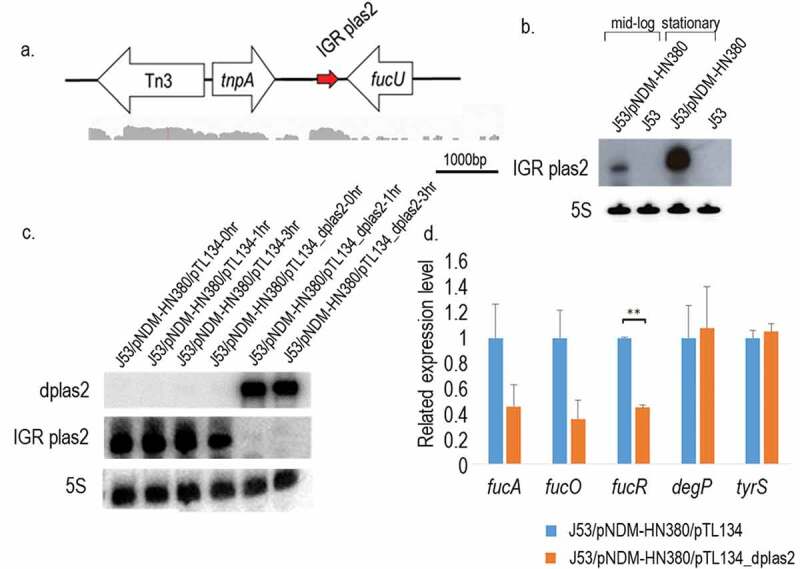
sRNA IGR plas2 and its decoy dplas2. (a). The genetic locus of IGR plas2. The arrow depicted in red is IGR plas2. RNA-sequencing reads showed below were captured using the Integrative Genomics Viewer (IGV) software. (b). Northern blot of IGR plas2. The experiment was performed at both log and stationary phases. The 5 S rRNA was used as control. (c). Northern blot validating the expression of dplas2 and the degradation of IGR plas2. The level of IGR plas2 was measured using the Northern blot assay at time points of 0, 1 and 3 hours after induction of dplas2. 5 S rRNA was used as control. (d). qRT-PCR of IGR plas2 target genes. Relative mRNA levels of predicted target genes of IGR plas2 were measured after the knockdown of IGR plas2. fucA, fucO, and fucR are functional genes in the fuc operon. J53/pNDM-HN380/pTL134 were used as controls. IGR: Intergenic region. Bars indicate the standard deviation. ** p-value <0.01