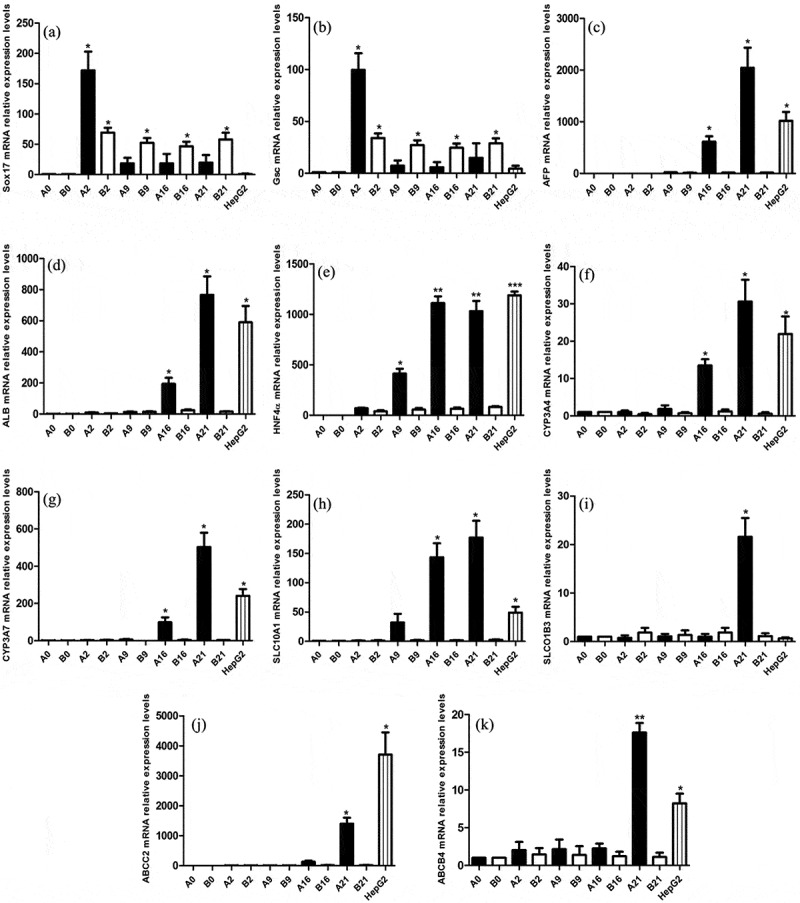
Figure 2.

Changes in endoderm and hepatocyte marker expression during induced differentiation. qRT-PCR analysis of the endodermic marker genes Sox17 and Gsc, and the hepatocellular signature genes AFP, ALB, HNF4a, CYP3A4, CYP3A7, SLC10A1, SLCO1B3, ABCC2, and ABCB4. β-Actin was used as an internal control. A0, A2, A9, A16, and A21 indicate samples from the experimental group at d 0, 2, 9, 16 and 21 of differentiation respectively. Samples of the control group at the corresponding time points are indicated with the letter “B”. HepG2 was the positive control. Values are expressed as means ± S.E.M. of three independent experiments. *p < .05, **p < .001 compared to control
