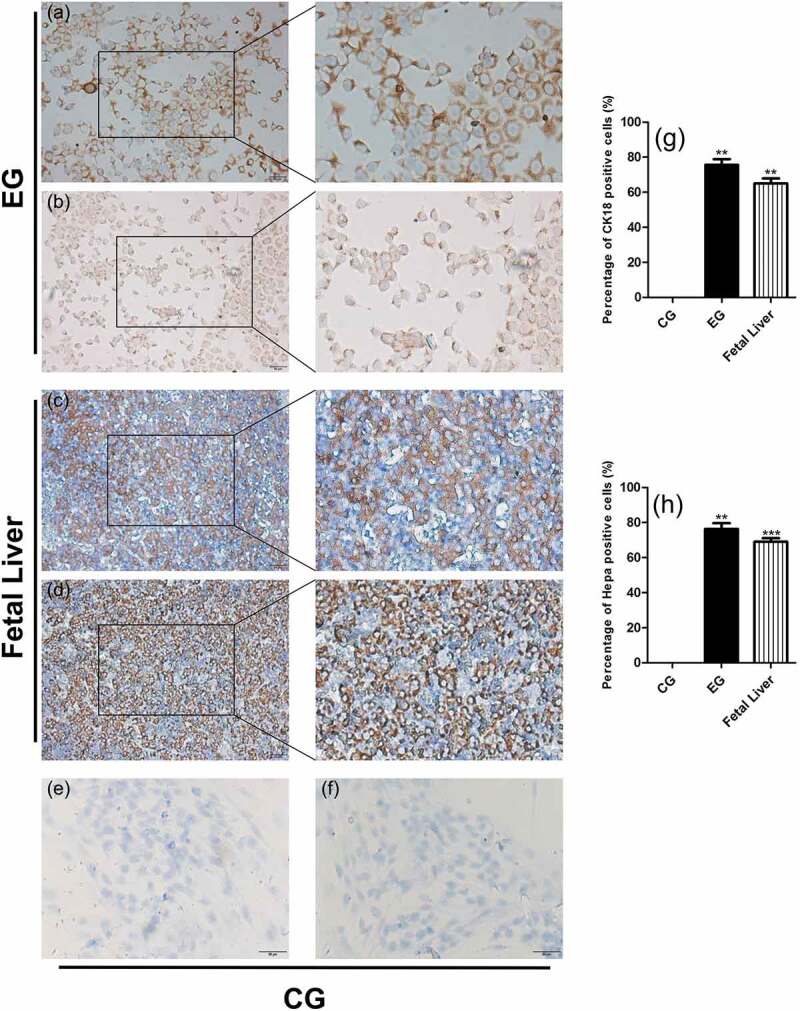
Figure 3.

Expression of hepatocyte marker proteins CK18 and Hepa in induced cells on d 21. CG represents the control group, EG represents the experimental group, and fetal liver tissue was used as the positive control. (a) CK18 staining in the experimental group. (b) Hepa staining in the experimental group. (c) CK18 staining in fetal liver. (d) Hepa staining in fetal liver. (e) CK18 staining in the control group. (f) Hepa staining in the control group. (g) Proportion of CK18-positive cells. (h) Proportion of Hepa-positive cells. Values were obtained from three independent experiments, and the two-tailed test was used. *p < .05, **p < .001 compared to control. Bars: 50 μm
