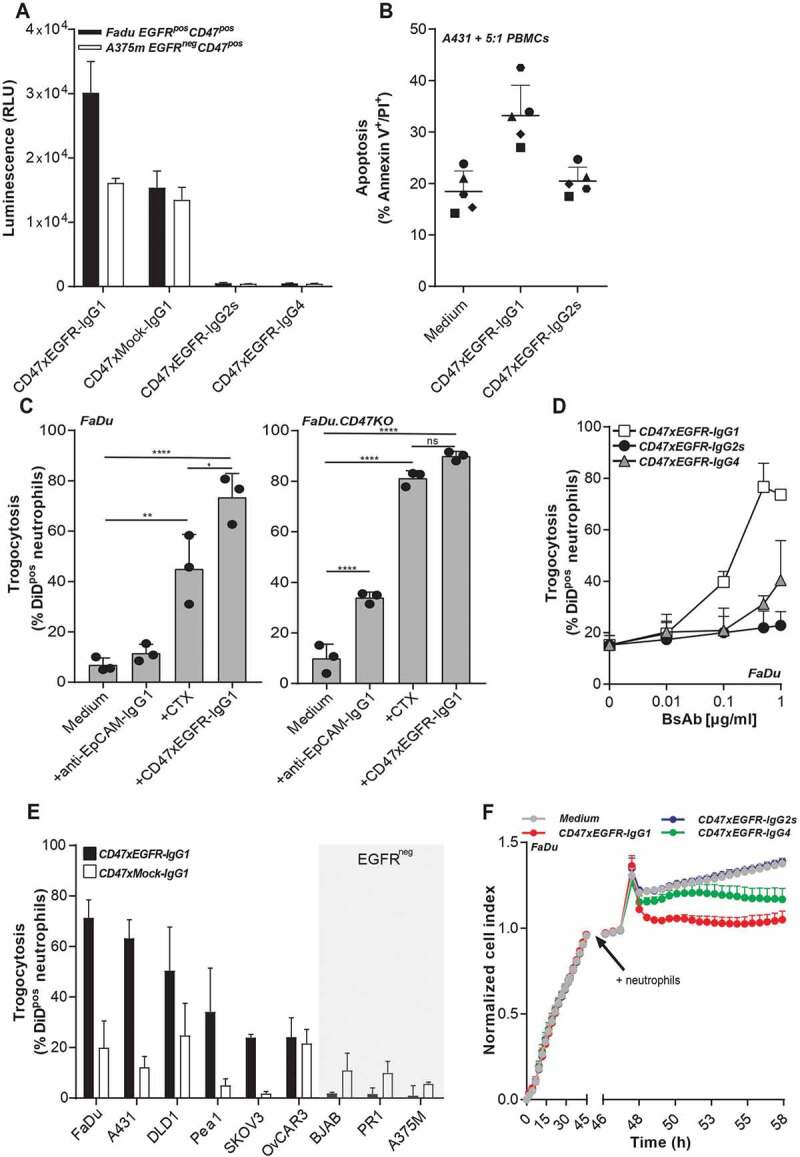
Figure 3.

BsAb CD47xEGFR-IgG1 induces ADCC (a) ADCC reporter bioassay in which EGFRpos FaDu cells or EGFRneg A375m cells were coincubated with Jurkat. FcγRIIIa-NFAT-luc cells in the presence of bsAb CD47xEGFR-IgG1, CD47xEGFR-IgG2s, CD47xEGFR-IgG4, or CD47xMock-IgG1 (0.1 µg/ml). Luciferase activity (RLU) was measured after 6 h. (b) Evaluation of bsAb CD47xEGFR‐IgG1 and bsAb CD47xEGFR‐IgG2s for their respective capacity to engage ADCC activity of freshly isolated PBMCs from 5 healthy volunteers toward A431 cancer cells endogenously expressing EGFR and CD47. PBMCs were cocultured with DiD‐labeled A431 cancer cells at an E:T cell ratio of 5:1 for 24 h in the presence (or absence) of bsAb CD47xEGFR‐IgG1 or CD47xEGFRIgG2s (2 μg/ml each). Induction of apoptotic cancer cell death (annexin Vpos/PIpos) was assessed by flow cytometry. BsAb CD47xEGFR-IgG1 induces neutrophil-mediated trogocytosis and trogoptosis toward CD47posEGFRpos cancer cells. (c) FaDu or FaDu.CD47KO cells were DiD-labeled and incubated with neutrophils at an E:T cell ratio of 1:1 in the presence of anti-EpCAM-IgG1 (2 µg/ml), CTX or CD47xEGFR-IgG1 (both 1 µg/ml). Trogocytosis was quantified as the percentage of DiDpos neutrophils by flow cytometry after 2 h. (d) Similar as in (b), trogocytosis was measured after DiD-labeled FaDu cells were incubated with neutrophils (E:T cell ratio of 1:1) in the presence of increasing concentrations (0.01–1 µg/ml) of bsAb CD47xEGFR-IgG1, CD47xEGFR-IgG2s or CD47xEGFR-IgG4. (e) Next, neutrophil-mediated trogocytosis of a panel of EGFRpos and EGFRneg DiD-labeled CD47-expressing cell lines was assessed in the presence of bsAb CD47xEGFR-IgG1 or CD47xMock-IgG1 (both 1 µg/ml). (f) xCELLigence real-time cytotoxicity assay shows neutrophil-induced trogoptosis of FaDu cells opsonized with bsAb CD47xEGFR-IgG1, -IgG2s, or -IgG4. After adhering, FaDu cells were coincubated with IFNγ-stimulated neutrophils (E:T cell ratio of 10:1) in the presence of indicated antibodies (2 µg/ml). Cell index was normalized prior to addition of neutrophils and antibodies. All graphs represent mean ± SD. Graphs (c–e) represent data of three independent experiments with neutrophils from three different donors. Error bars in F indicate SD of quadruplicates. Statistical analysis in C was performed using one-way ANOVA followed by a Tukey post-hoc test (*p < .05, **p < .01, ***p < .001, ****p < .0001, ns not significant)
