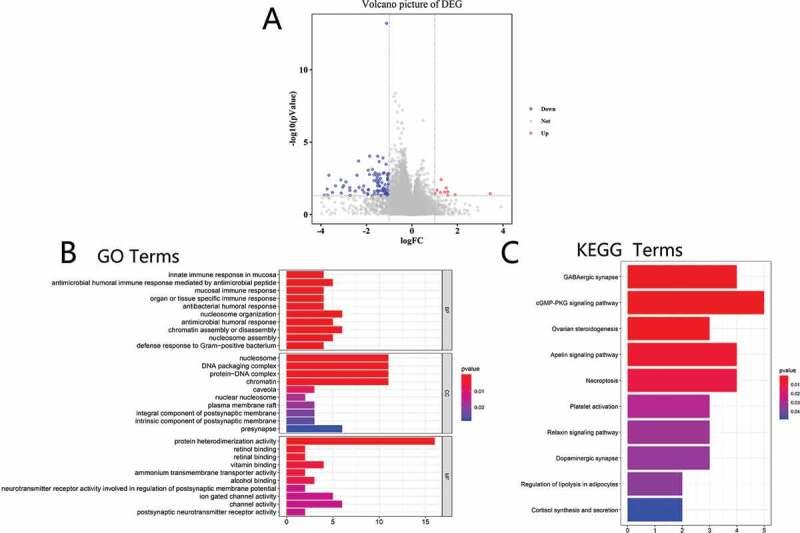
Figure 4.

Cluterprofiler enrichment results of differentially expressed genes. (a) Volcano plot for differentially expressed genes. (b) The GO enrichment terms of differentially expressed genes. (c) The KEGG pathway analysis of differentially expressed genes
