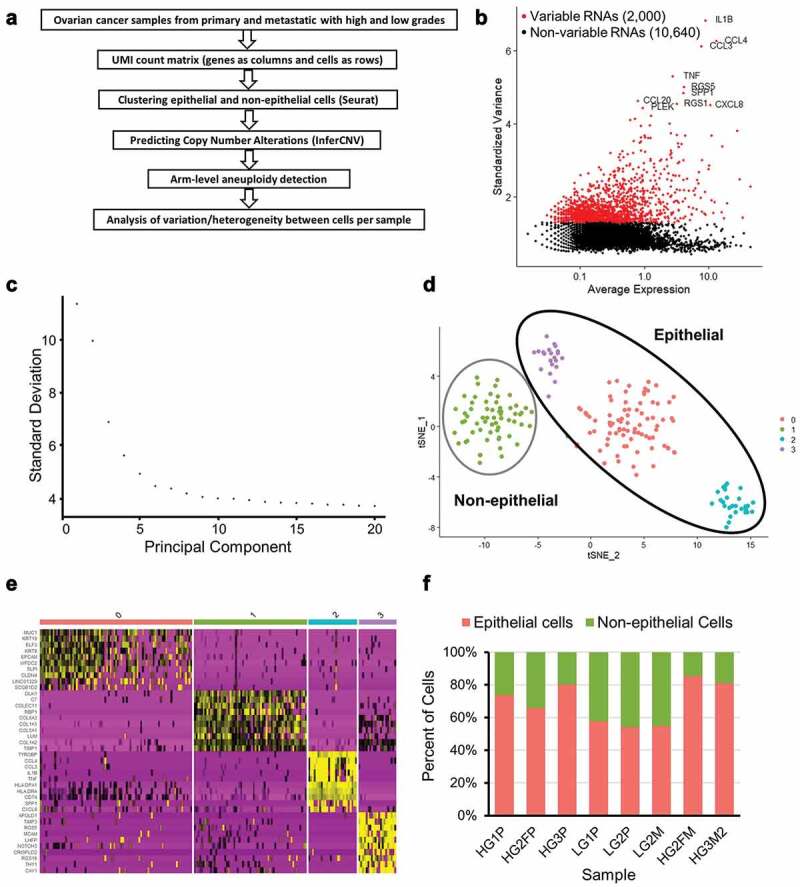
Figure 1.

Preparation of ovarian cancer scRNA-seq data for CNA analysis. (a) Overview of scRNA-seq to CNA analysis. (b) Highly variable genes in LG1P (top 10 variable genes are labeled). (c) Elbow plot of LG1P principal components. (d) Identified cell clusters in LG1P using t-SNE clustering of scRNA-seq data (e) Top 10 markers that define each cell cluster in LG1P. Non-epithelial cell cluster (green) shows the upregulation of collagen genes (COL1A1, COL1A2, COL5A1, COL6A3). Column color labels match the clustered cell colors in panel D. (f) Proportion of epithelial and non-epithelial cells in each sample
