
Figure 1.
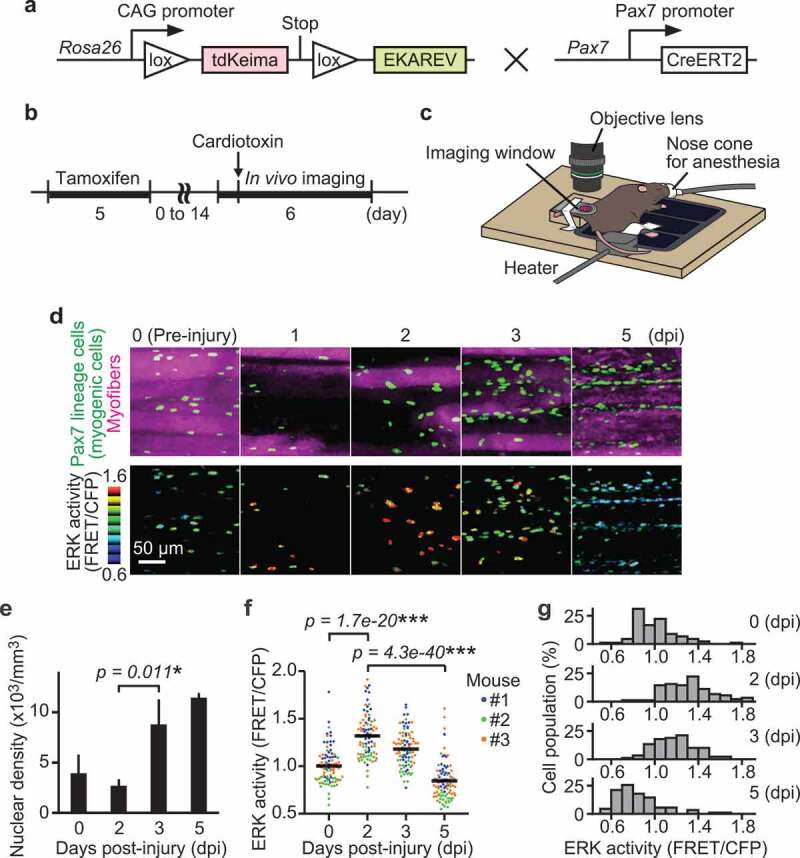
ERK is activated in myogenic cells during muscle regeneration. (a) Scheme of R26R-EKAREV/Pax7-CreERT2 mice. (b) Experimental scheme of Cre-mediated recombination and in vivo imaging of skeletal muscle regeneration. (c) Layout for the in vivo imaging system. The muscle under the imaging window was observed with a two-photon microscope repetitively. (d) Representative images of regenerating muscles expressing EKAREV and tdKeima at 0, 1, 2, 3, and 5 days post-injury (dpi). The nuclei of Pax7 lineage cells (satellite cell-derived myogenic cells) express EKAREV are shown in green, while the myofibers that existed before injury express tdKeima and are shown in magenta (top panels). Note that the nuclei of Pax7 lineage cells include the myonuclei of myotubes or myofibers at 5 dpi. Biceps femoris muscles were imaged at indicated time points; maximum intensity projection images of 30 µm z-stack with 2 µm intervals are shown. EKAREV-NLS was used to monitor ERK activity in the nucleus. ERK activity (FRET/CFP) images of myogenic cells shown in the intensity-modulated display (IMD) mode (bottom panels). (e) Averaged nuclear density of myogenic cells calculated from the z-stack images (bars, SDs; N = 3 mice for each day; *p < 0.05). (f and g) Bee swarm plot (f) and histogram (g) of ERK activity (FRET/CFP) in myogenic cells. Each color represents data from a single mouse in (f) (bars, averages; N = 3 mice for each day; ***p < 0.001)