
Figure 4.
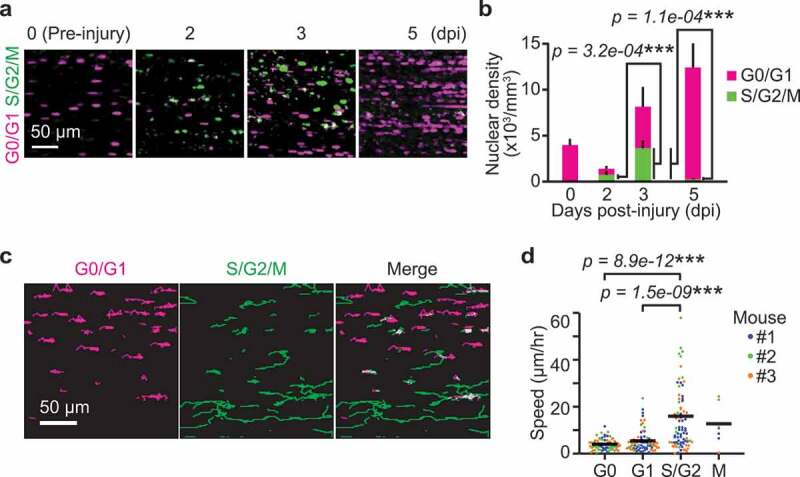
Migration speed of myogenic cells increases in S/G2 phase. (a) Representative images of myogenic cells expressing Fucci at 0, 2, 3, and 5 dpi. Biceps femoris muscles were imaged as indicated time points, and shown in maximum intensity projection images of 100 µm z-stack with 2 µm intervals. Magenta and green dots indicate cells in G0/G1 phase and those in S/G2/M phase, respectively. (b) Averaged nuclear densities of myogenic cells expressing Fucci calculated from the z-stack images (bars, SDs; N = 3 mice for each day; ***p < 0.001). (c) Representative images of cell trajectories for 4 hours at 3 dpi. Magenta and green lines indicate the trajectories of cells in G0/G1 phase and those in S/G2/M phase, respectively. (d) Migration speed of myogenic cells expressing Fucci during each cell cycle phase at 3 dpi. Cells in the G0 and G1 phase were determined by the intensity of mCherry-hCdt1 (Figure S3(a,b)). Cells in the M phase was discriminated from cells in S/G2 phase by cytosolic distribution and subsequent disappearance of mVenus-hGeminin (Figure S3(c)). Each color represents data from a single mouse (bars, averages; N = 3 mice for each day; ***p < 0.001)