
Figure 5.
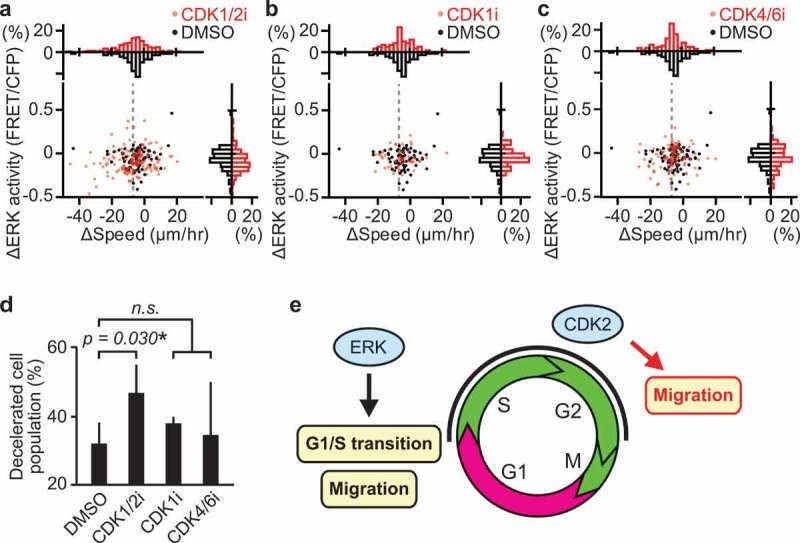
CDK2 promotes myogenic cell migration during muscle regeneration. (a–c) Changes in migration speed and in ERK activity in myogenic cells, calculated by subtracting values before the drug treatment from values after the drug treatment. Gray dashed lines indicate -7 µm/hr, which was chosen as the threshold for classifying cells as decelerated. Histograms of the difference in migration speed and ERK activity are shown at the top and right side of the figure, respectively (N = 4 mice for DMSO group; N = 4 mice for CDK1/2i group; N = 3 mice for CDK1i group; N = 3 mice for CDK4/6i group). Mice expressing EKAREV-NLS in myogenic cells were injected intravenously with DMSO (1 mL/kg), CDK1/2 inhibitor (roscovitine, 0.05 mg/kg), CDK1 inhibitor (RO-3306, 1 mg/kg), or CDK4/6 inhibitor (palbociclib, 1 mg/kg) during in vivo imaging at 3 dpi. (d) Percentage of cells classified as decelerated after DMSO or CDK inhibitors. Migrating myogenic cells that decreased their speed more than 7 µm/hr are defined as “decelerated” and taken into account (bars, SDs; *p < 0.05; n.s., not significant). (e) Schematic model of cell cycle progression and cell migration by ERK and CDK2 in myogenic cells during muscle regeneration