
Figure 3.
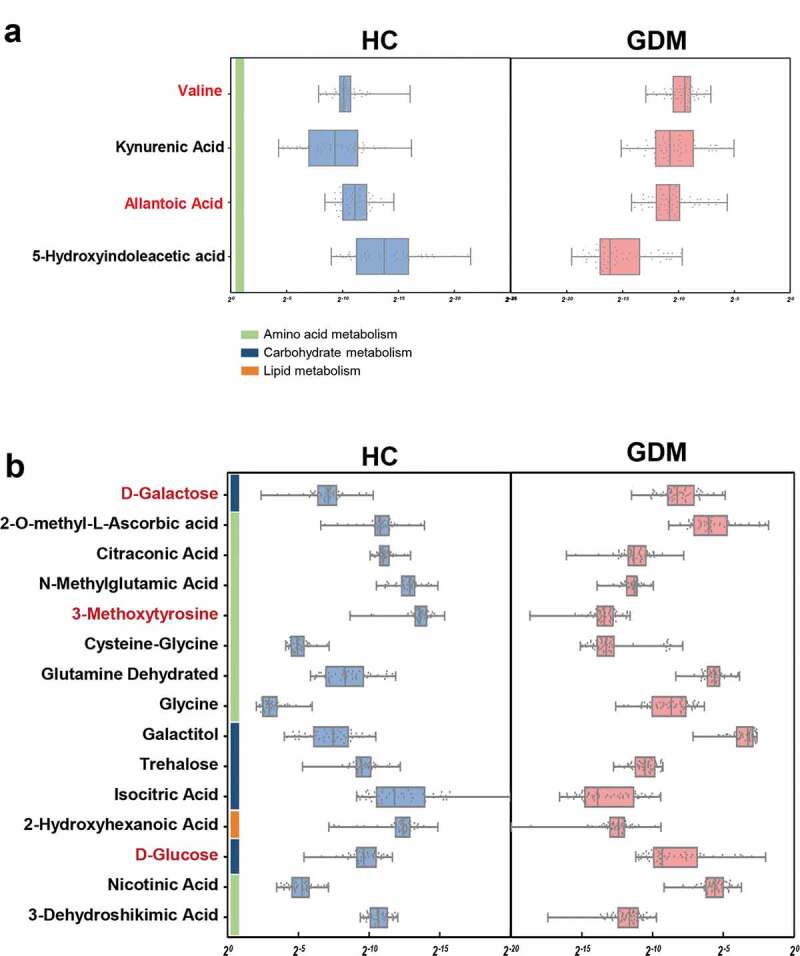
Altered metabolites in fecal and urine samples of GDM. (a) Relative abundances of 4 fecal metabolites responsible for differentiation between the two groups. Compared to HCs, patients with GDM were characterized by 2 up-regulated metabolites (red) and 2 down-regulated metabolites (black). These metabolites were mainly involved in amino acid metabolism. (b) Similarly, GDM individuals were characterized by 3 up-regulated (red) and 12 down-regulated (black) urine metabolites relative to HCs (VIP>1, p < .05). These altered urine metabolites were mainly belonged to carbohydrate and amino acid metabolism