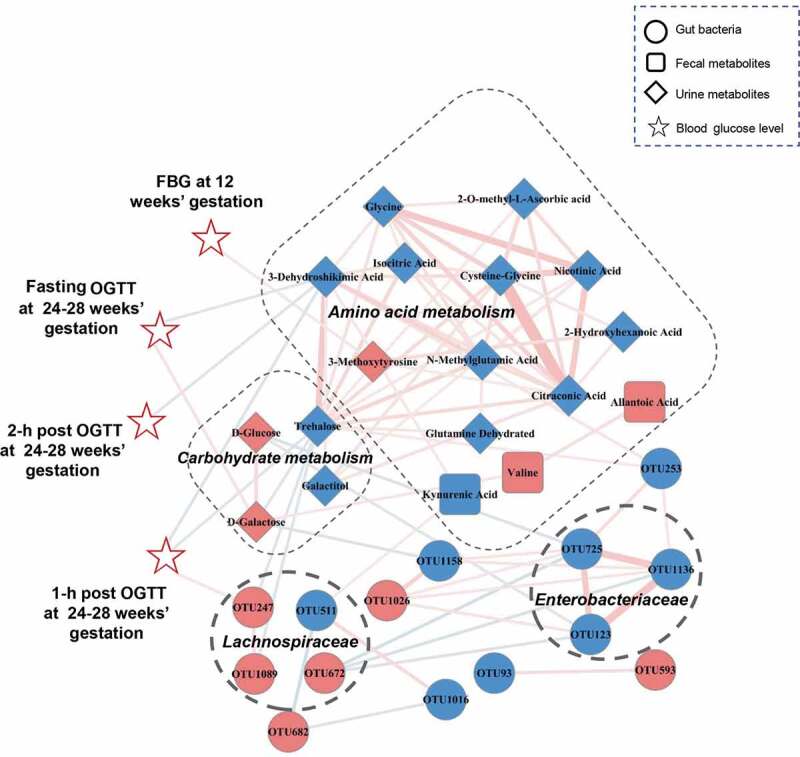
Figure 5.

A co-occurrence network constructed from the relative abundances of differential bacterial OTUs, fecal and urine metabolites as well as blood glucose values in GDM subjects versus HCs. The spearman correlation analysis was used to explore the co-occurrence network. The relevant networks with Spearman’s correlation (r) > 0.25 or < −0.25 were shown. Overall, bacterial OTUs belonged to families Enterobacteriaceae and Lachnospiraceae formed strong co-occurring relationships with metabolites assigned to carbohydrate and amino acid metabolism. In addition, within this co-expression network, some of metabolites and bacterial OTU (Lachnospiraceae_OTU 247) also showed significant correlations with glucose values of FBG at 12 weeks’ gestation or OGTT at 24–28 weeks’ gestation. These characteristic co-expression network formed synergistic relationships in GDM. Size of the nodes represents the fold changes (GDM relative to HC) of these variables. Red and blue dots indicate the increased and decreased relative abundances of variables in GDM subjects relative to HCs, respectively. Edges between nodes indicate Spearman’s negative (light blue) or positive (light red) correlation, edges thickness indicate range of p value (p < .01). Abbreviations: fasting blood glucose, FBG; oral glucose tolerance test, OGTT
