
Figure 2.
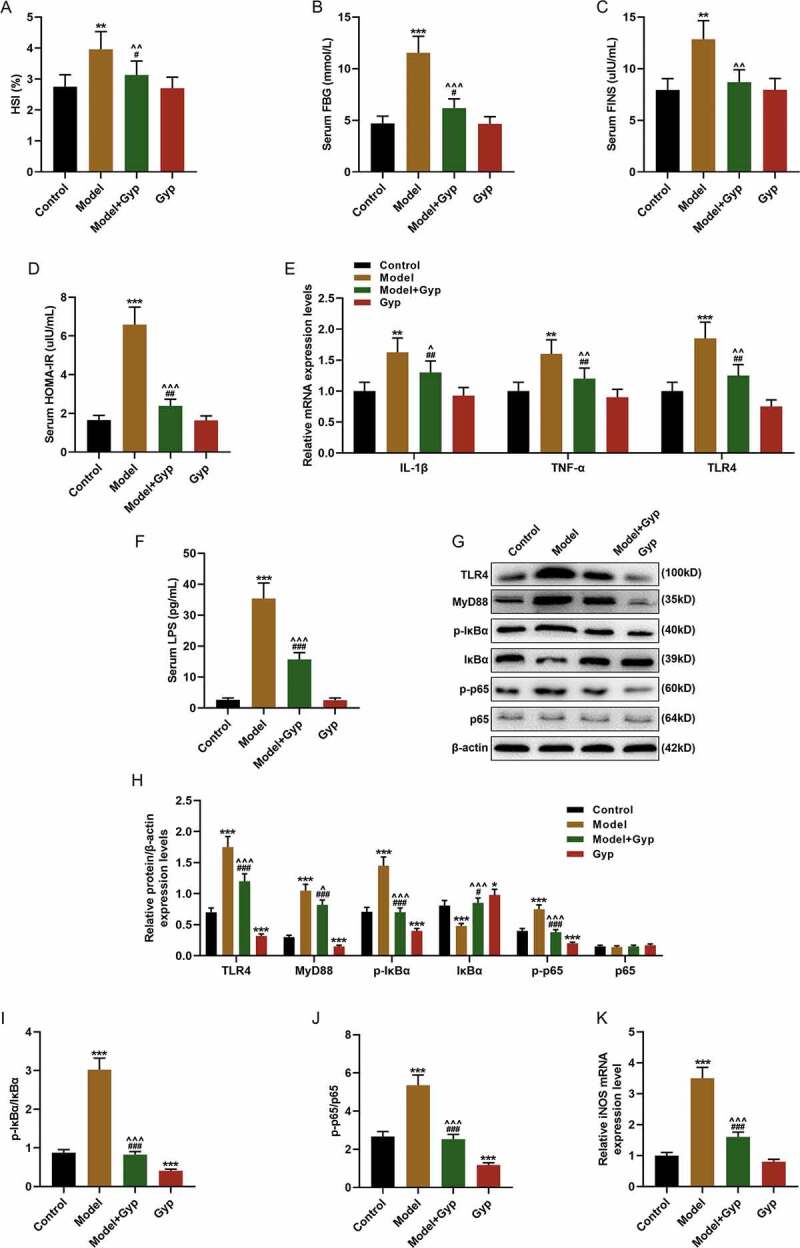
Effect of Gypenosides on biochemical indicators and inflammatory factor and LPS/TLR4 downstream pathway in NAFLD rat model (a) hepatic steatosis index (HSI) of rats was evaluated. (b) Fasting blood glucose (FBG) of rats was measured. (c) Fasting insulin (FINS) of rats was detected. (d) Insulin resistance (HOMA-IR) of rats was evaluated. (e) The expressions of IL-1β, TNF-α, and TLR4 were detected by qRT-PCR. (f) Serum LPS concentration was detected by ELISA kits. (G, H, I and J) The expressions of TLR4, MyD88, p-IκBα, κBα and p-p65 and p65 were detected by Western blotting. (k) QRT-PCR was used to detect the iNOS expression in liver tissue. n = 3, *P < 0.05, **P < 0.01, ***P < 0.001, vs. Control; ^P < 0.05, ^^P < 0.01, ^^^P < 0.001, vs. Model; #P < 0.05, ##P < 0.01, ###P < 0.001, vs. Control