
Figure 3.
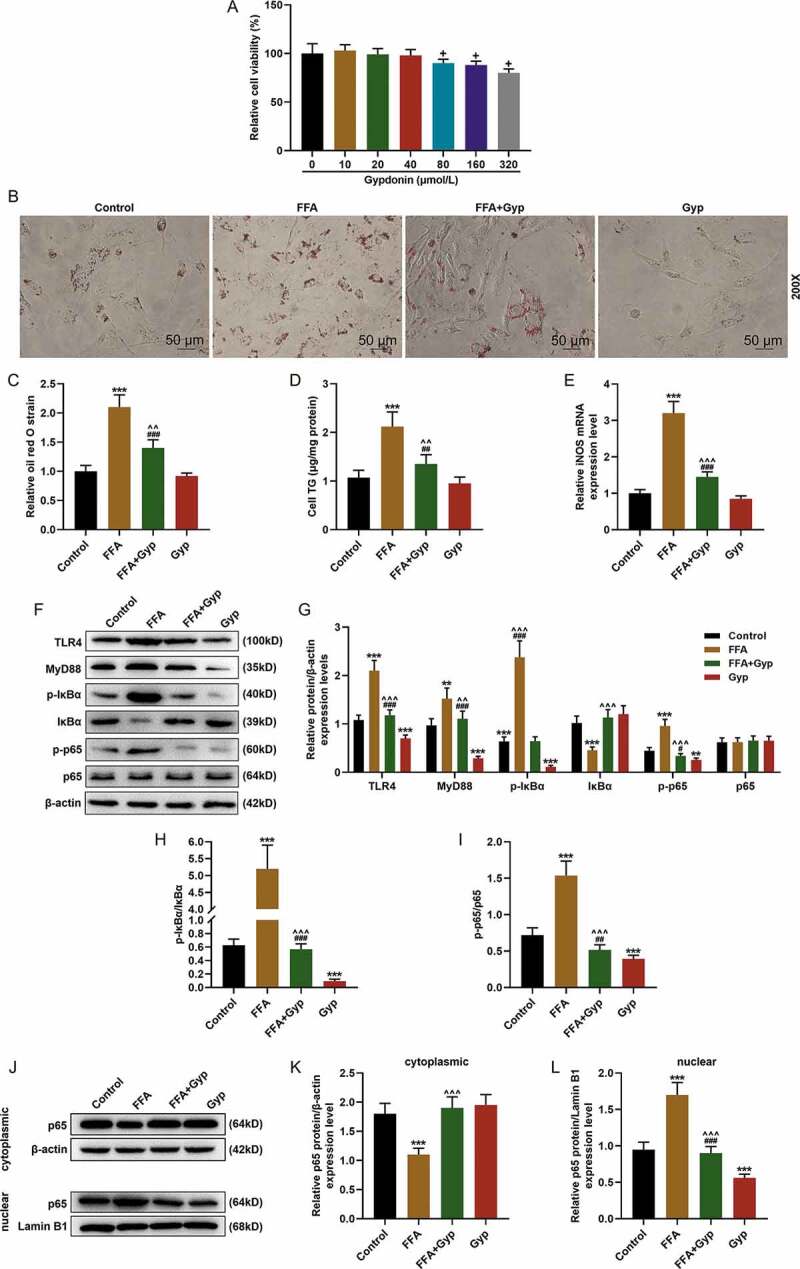
The effect of Gypenosides on FFA-induced adipogenesis in THLE-2 cells and the effect on LPS/TLR4 downstream pathways in THLE-2 cells (a) MTT was used to detect the viability of THLE-2 cell treated with different concentrations of Gyp (10 μmol/L, 20 μmol/L, 40 μmol/L, 80 μmol/L, 160 μmol/L, and 320 μmol/L,). (b and c) Oil Red O staining was used to detect lipid droplet deposition of FFA-induced THLE-2 cell that treated with 40 μmol/L Gyp. (d) Kit used to detect triglyceride (TG) content in cells. (e) The iNOS expression was detected by qRT-PCR in cells. (F, G, H and I) The expression levels of TLR4, MyD88, p-IκBα, κBα, and p-p65 and p65 were detected by Western blotting. (J, K, and L) The p65 expression in cytoplasm and nucleus were detected by Western blotting. n = 3, +P < 0.05, ++P < 0.01, +++P < 0.001, vs. 0; *P < 0.05, **P < 0.01, ***P < 0.001, vs. Control; ^P < 0.05, ^^P < 0.01, ^^^P < 0.001, vs. FFA; #P < 0.05, ##P < 0.01, ###P < 0.001, vs. Gyp; &P < 0.05, &&P < 0.01, &&&P < 0.001, vs. FFA+Gyp+NC