
Figure 3.
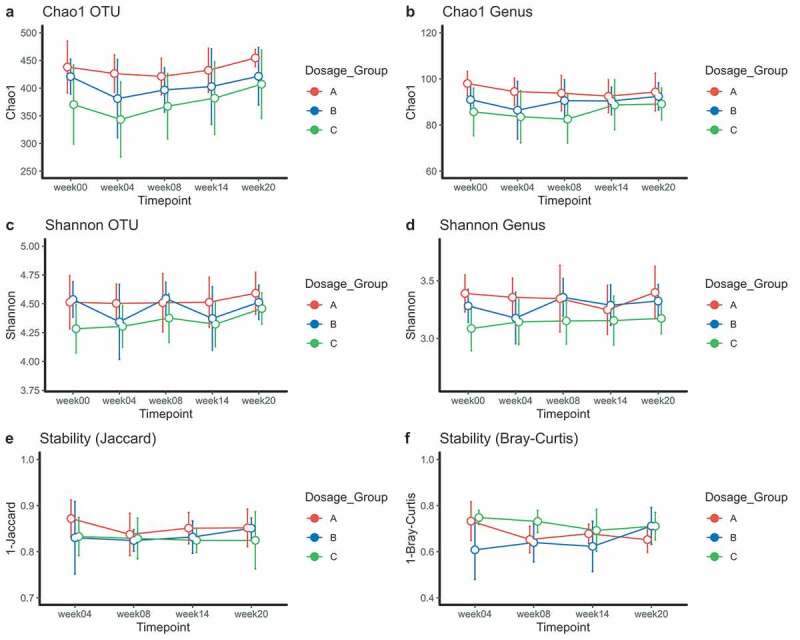
Richness (Chao1) and diversity plots at OTU and genus level (a-d) and stability measures (Jaccard and Bray-Curtis) for larval dosage groups (e-f). Total infectious dosages for group A (red): 50L3 larvae, group B (blue): 100L3 larvae and C (green): 150L3 larvae. Means and the 95% CI of the standard error of the mean are displayed. *p < .05, **p < .01, ***p < .001