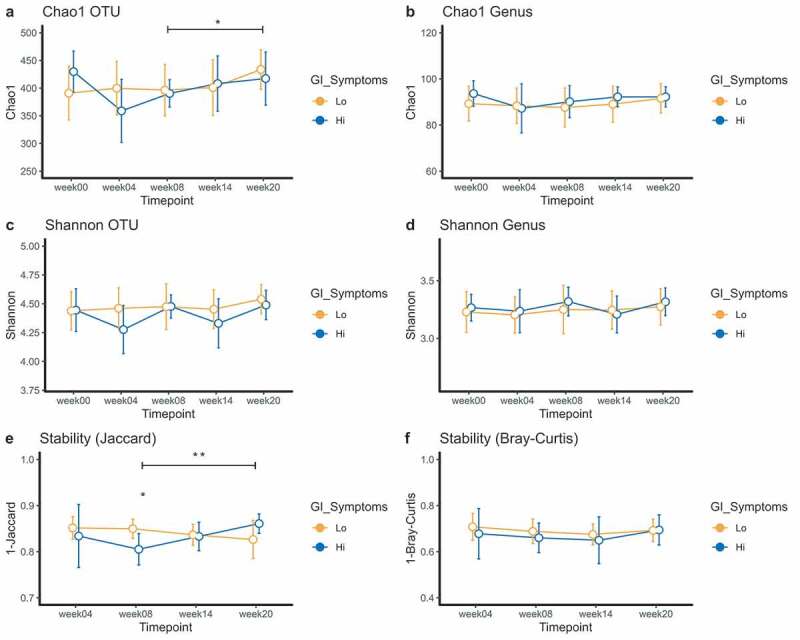
Figure 4.

Richness (Chao1) and diversity plots at OTU and genus level (a-d) and stability measures (Jaccard and Bray-Curtis) for GI symptoms groups (e-f). For figure A, significance between trial week eight and week twenty is for the “lo” GI symptoms group (orange). For Figure E, significance between trial week eight and week twenty is for the “hi” GI symptoms group (blue). Means and the 95% CI of the standard error of the mean are displayed. *p < .05, **p < .01, ***p < .001
