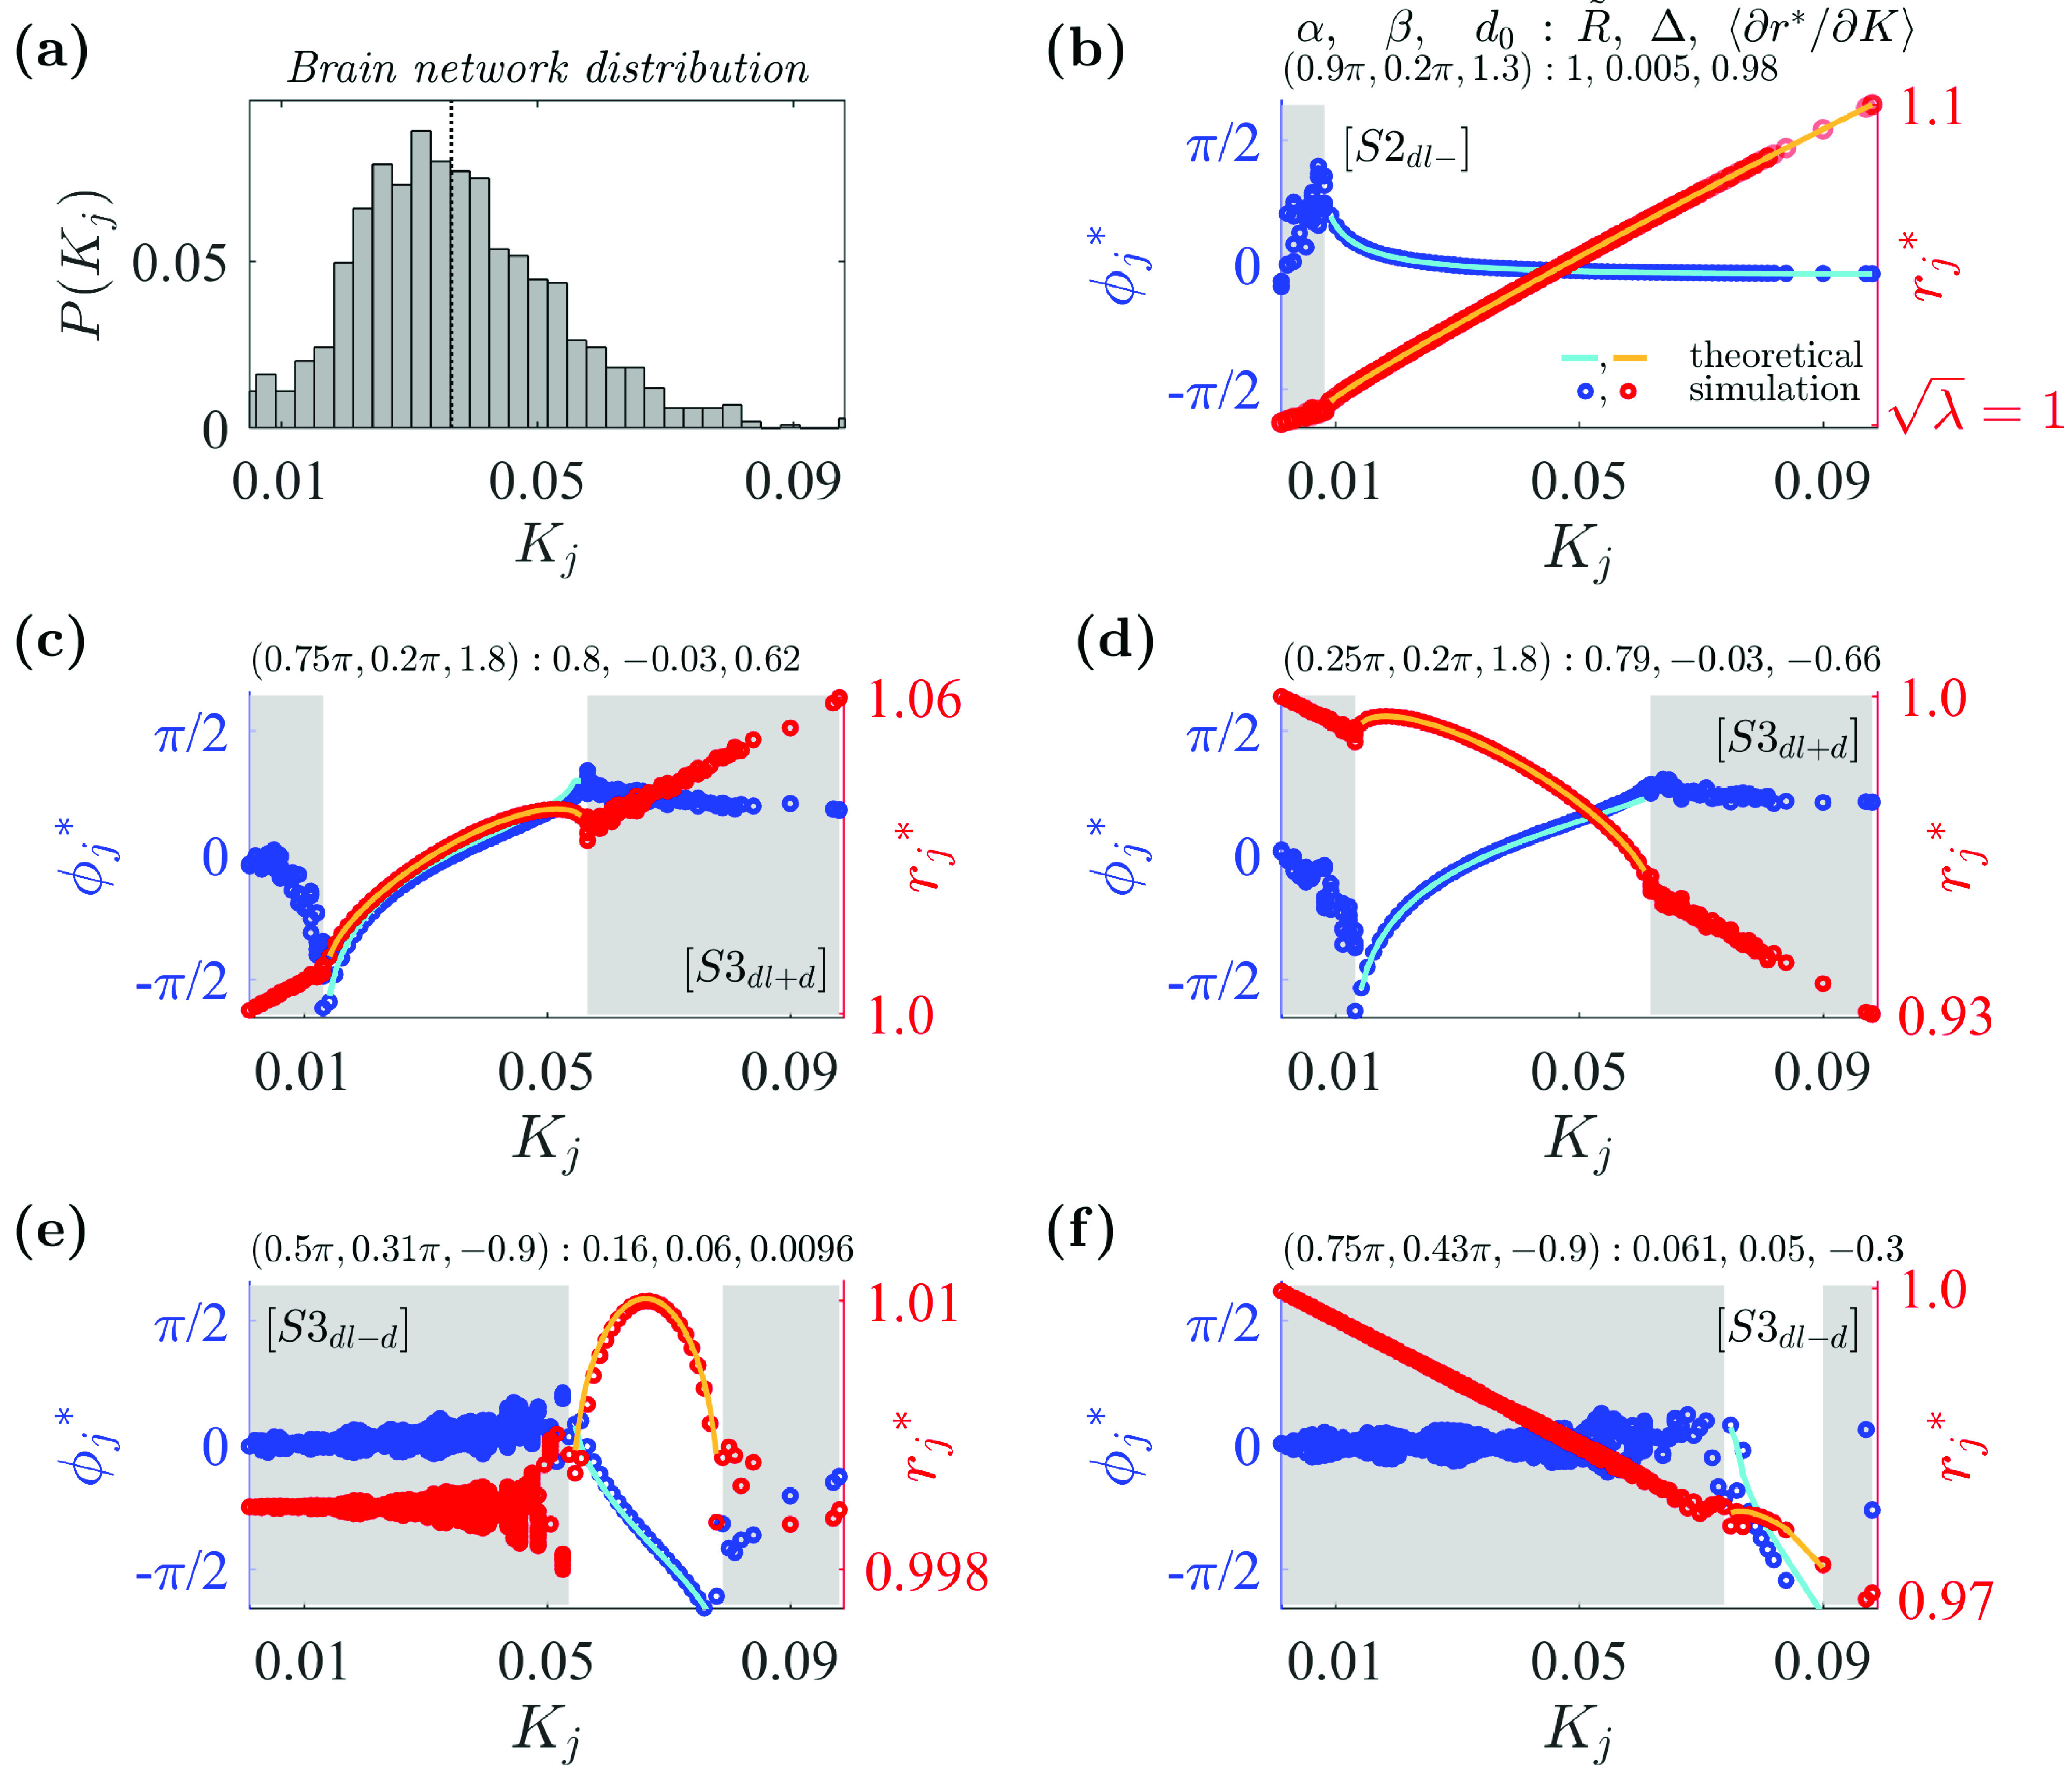
FIG. 6.

Examples of various synchronous states in the system with the human brain network coupling strength distribution. (a) Distribution for coupling strengths obtained from a brain-network distribution. For the obtained coupling strength set , (vertical dotted line), , , and . (b) State with a positive amplitude slope: and . Satisfies additional condition . (c) State with a positive amplitude slope: and . Satisfies additional conditions . (d) State with a negative amplitude slope. Additional conditions are as in (c). (e) State with a positive–negative amplitude slope: and . Satisfies additional conditions . (f) State with a negative amplitude slope. Additional conditions are as in (e). Other details are as in Fig. 2. Simulation parameters: , , , .
