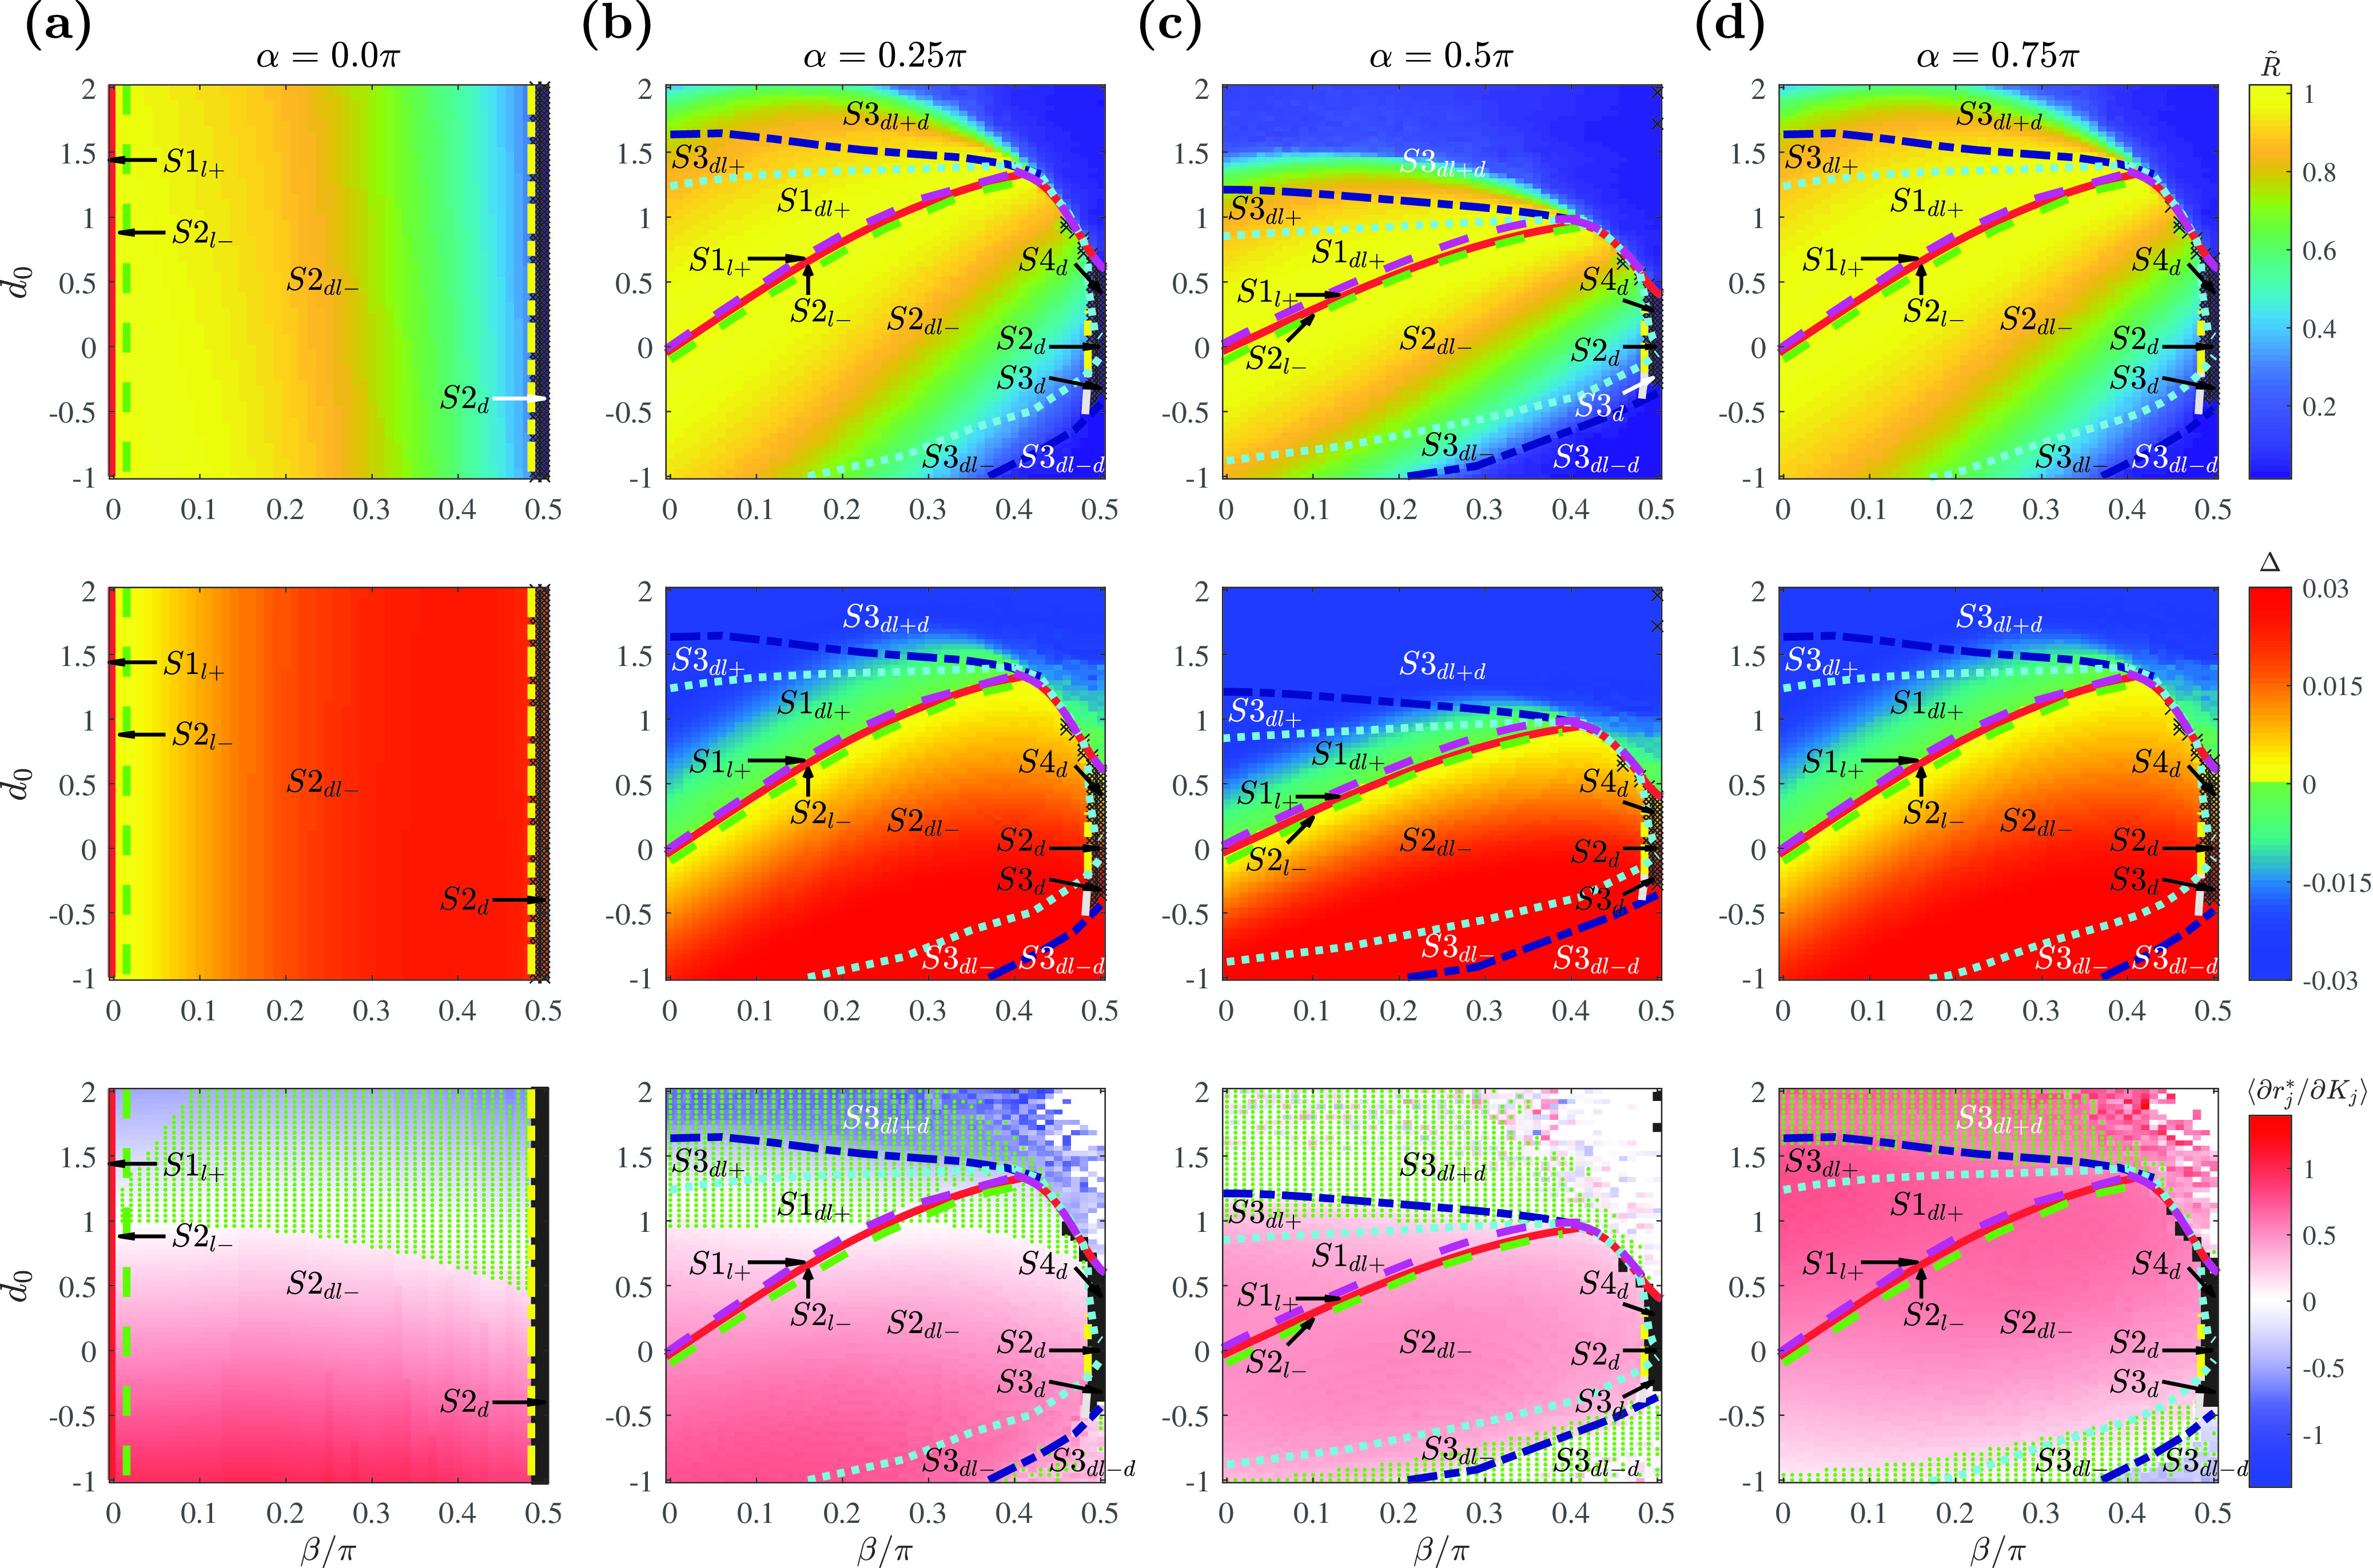
FIG. 7.

Phase diagram with the human brain network coupling strength distribution as a function of , , and determining the form of the coupling function. Representative fixed values of are chosen at (a) where , (b) where , (c) where , and (d) where . Phase diagrams with order parameter (first row), phase spread (second row), and the slope of the amplitude curve calculated as the average value of among the locked oscillators (third row). The boundaries and other details are as in Fig. 3. For the obtained coupling strength set with , . Simulation parameters: , , , .
