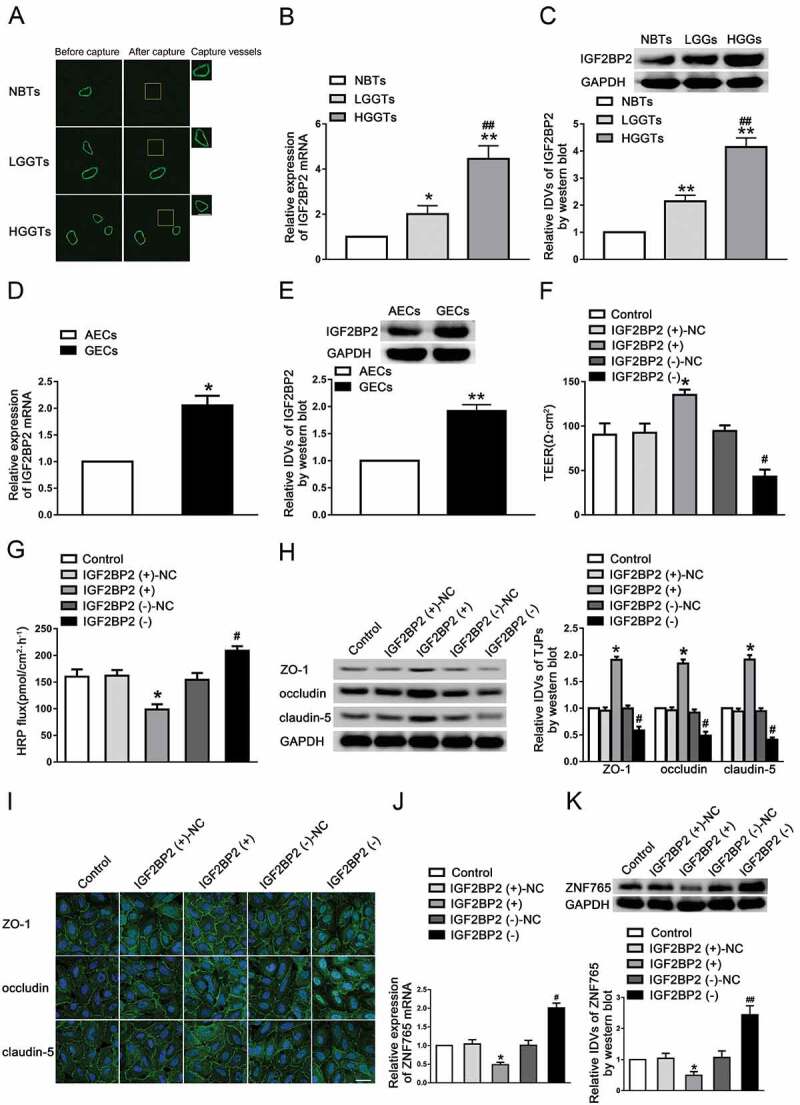
Figure 1.

Knockdown of IGF2BP2 increased BTB permeability in vitro
(A) Staining vessel from normal or glioma brain tissues with the UEA-I. LCM capture of UEA-I-stained vessel from human brain sections. Scale bars represent 40 μm. (B,C) The mRNA and protein expression levels of IGF2BP2 were higher in glioma tissues than in normal brain tissues (NBTs), and highest in low-grade glioma tissues (LGGTs). Data represent means ± SD (n = 3, each). *P < 0.05, **P < 0.01 vs. NBTs group, ##P < 0.01 vs. LGGTs group. (D,E) The mRNA and protein expression levels of IGF2BP2 were higher in glioma endothelial cells (GECs) than in astrocyte-exposed endothelial cells (AECs). Data represent mean ± SD (n = 3, each). *P < 0.05, **P < 0.01 vs. AECs group. (F,G) Knockdown of IGF2BP2 decreased TEER values and increased HRP flux. (H) Knockdown of IGF2BP2 decreased the expression levels of ZO-1, occludin and claudin-5. Data represent mean ± SD (n = 3, each). *P < 0.05 vs. IGF2BP2 (+)-NC group, #P < 0.05 vs. IGF2BP2 (-)-NC group. (I) Knockdown of IGF2BP2 damaged the continuity of ZO-1, occludin and claudin-5 distributions. Scale bar represents 30 μm. (J,K) Knockdown of IGF2BP2 decreased the mRNA and protein expression levels of ZNF765. Data represent mean ± SD (n = 3, each). *P < 0.05 vs. IGF2BP2 (+)-NC group, #P < 0.05 vs. IGF2BP2 (-)-NC group. QRT-PCR results were analysed using the relative quantification (2–ΔΔCT) method, and blots were analysed in terms of IDVs. All results were analysed using one-way ANOVA test.
