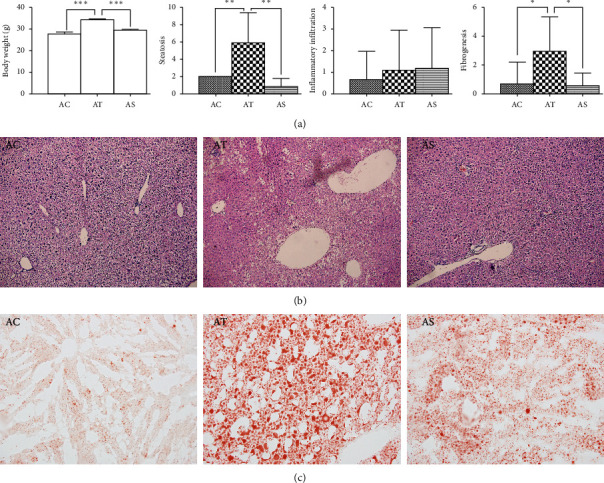
Figure 1.

Comparation of body weight and histopathological injuries among groups. (a) Statistical analysis of body weight and pathological score. AC: control group; AT: NAFLD group; AS: SJP treatment group. ∗p < 0.05, ∗∗p < 0.01, and ∗∗∗p < 0.001. (b) Pathological images of liver among diverse groups. Hematoxylin-eosin counterstain. Histological images are presented with original magnifcation 200x. Liver in HFG exhibited enlarged hepatocytes and extensive vacuolization which indicated liver steatosis in the AT group, and these changes were ameliorated in the AS group. (c) Oil red O staining of frozen liver sections. The frozen liver sections showed significant lipid droplets accumulation in the AT group, and the lipid droplets accumulation decreased dramatically in the AS group.
