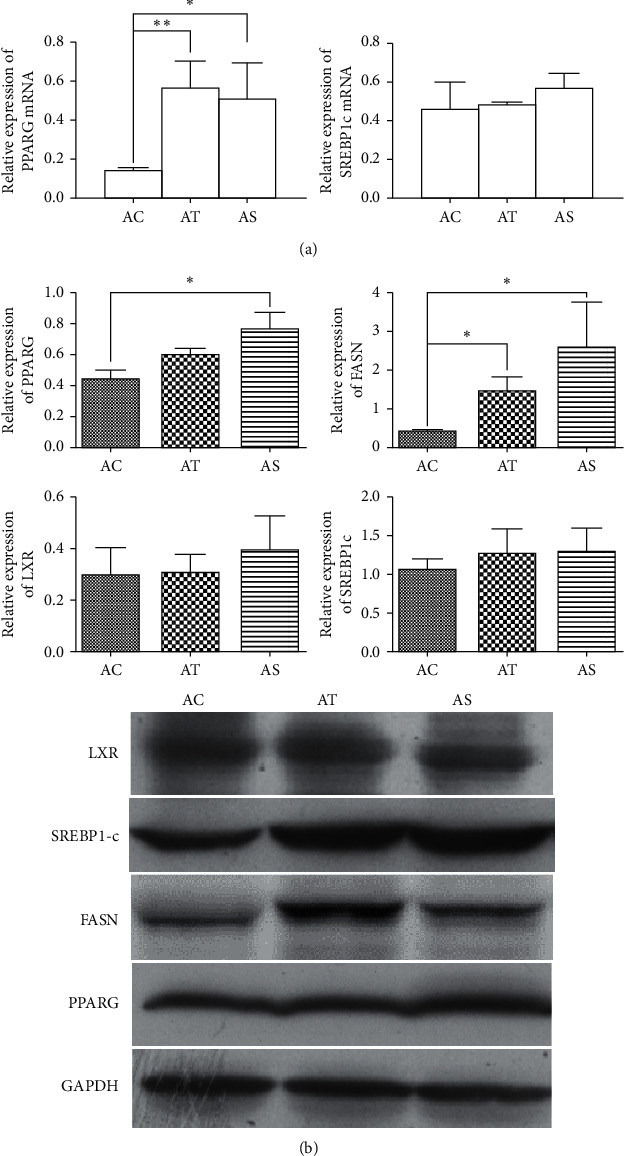
Figure 3.

Expression of LXR, SREBP1-c, FASN, and PPARγ. (a) Expression of SREBP1-c mRNA and PPARγ mRNA quantified by PCR. (b) Western blot analysis of LXR, SREBP1-c, FASN, and PPARγ in liver samples among diverse groups. ∗p < 0.05 and ∗∗p < 0.01.

Expression of LXR, SREBP1-c, FASN, and PPARγ. (a) Expression of SREBP1-c mRNA and PPARγ mRNA quantified by PCR. (b) Western blot analysis of LXR, SREBP1-c, FASN, and PPARγ in liver samples among diverse groups. ∗p < 0.05 and ∗∗p < 0.01.