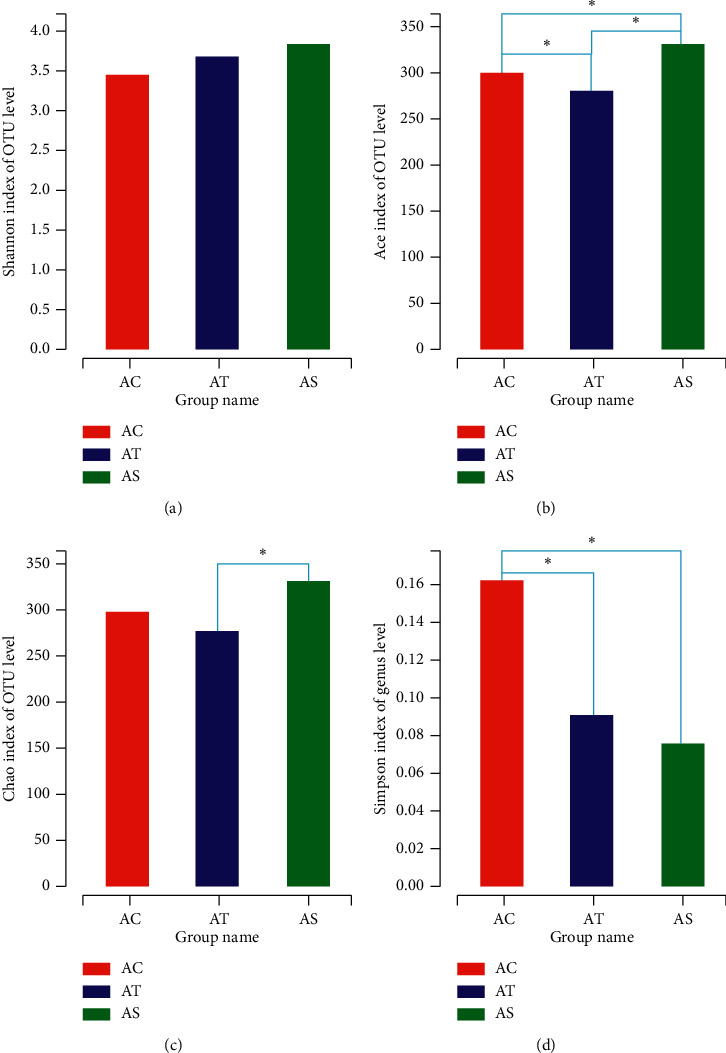
Figure 4.

α-Diversity analysis of gut microbiota among the three experimental groups. Shannon and Simpson indexes indicate the community diversity (a, d), and Chao and Ace indexes indicate the community richness (b, c). ∗p < 0.05.

α-Diversity analysis of gut microbiota among the three experimental groups. Shannon and Simpson indexes indicate the community diversity (a, d), and Chao and Ace indexes indicate the community richness (b, c). ∗p < 0.05.