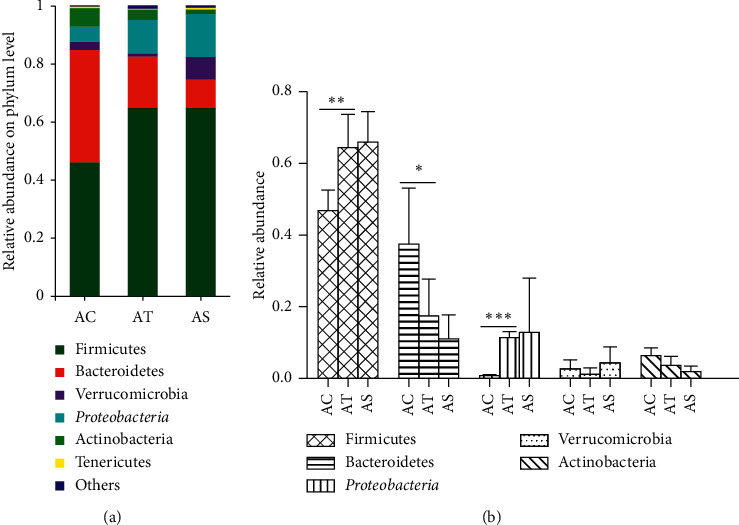
Figure 6.

Relative abundance of intestinal microbiota at phylum level. Species with less than 1% abundance was classified into the “others” category. Differences in the microbial community abundance among the three groups were analyzed by one-way ANOVA. ∗p < 0.05, ∗∗p < 0.01, and ∗∗∗p < 0.001.
