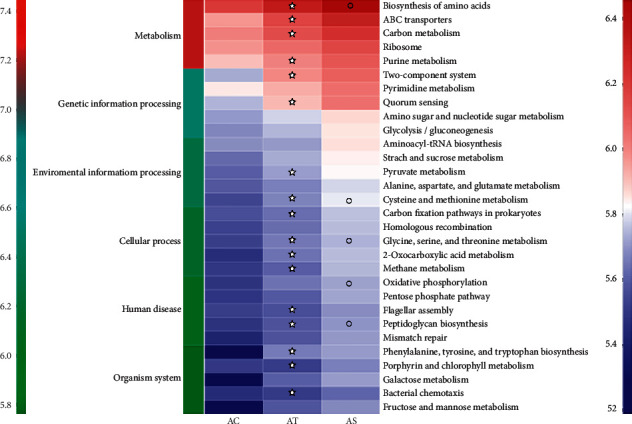
Figure 9.

Function prediction of the gut microbiota. Top 30 high abundant species were included for function prediction using PICRUSt2. The x-axis indicates the sample groups, the y-axis indicates different pathways (left green-blue-red gradient bar represents pathway level 1, and right blue-white-red gradient bar represents pathway level 3). ✮, compared to the AC group, p < 0.05; ○, compared to the AT group, p < 0.05.
