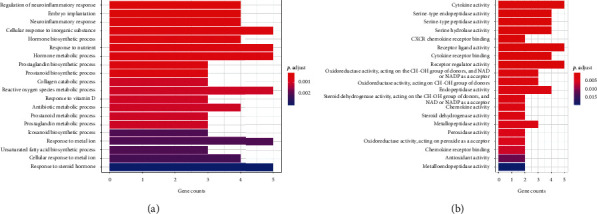
Figure 4.

Barplot of GO functional enrichment analysis. (a) The top 20 notable GO-BP terms enriched by target genes in the pharmacological network. (b) The top 20 notable GO-MF terms enriched by target genes in the pharmacological network. Each bar represents a GO term on the vertical axis. The number of genes enriched in each term is recorded on the horizontal axis. Color of each bar represents the adjusted p value of each GO term. More red the color of the term is, smaller its adjusted p value is. Abbreviations: GO, Gene Ontology; BP, biological process; MF, molecular function.
