
Figure 1: IL33 protein contents are elevated in the Scnn1b-Tg+ lungs.
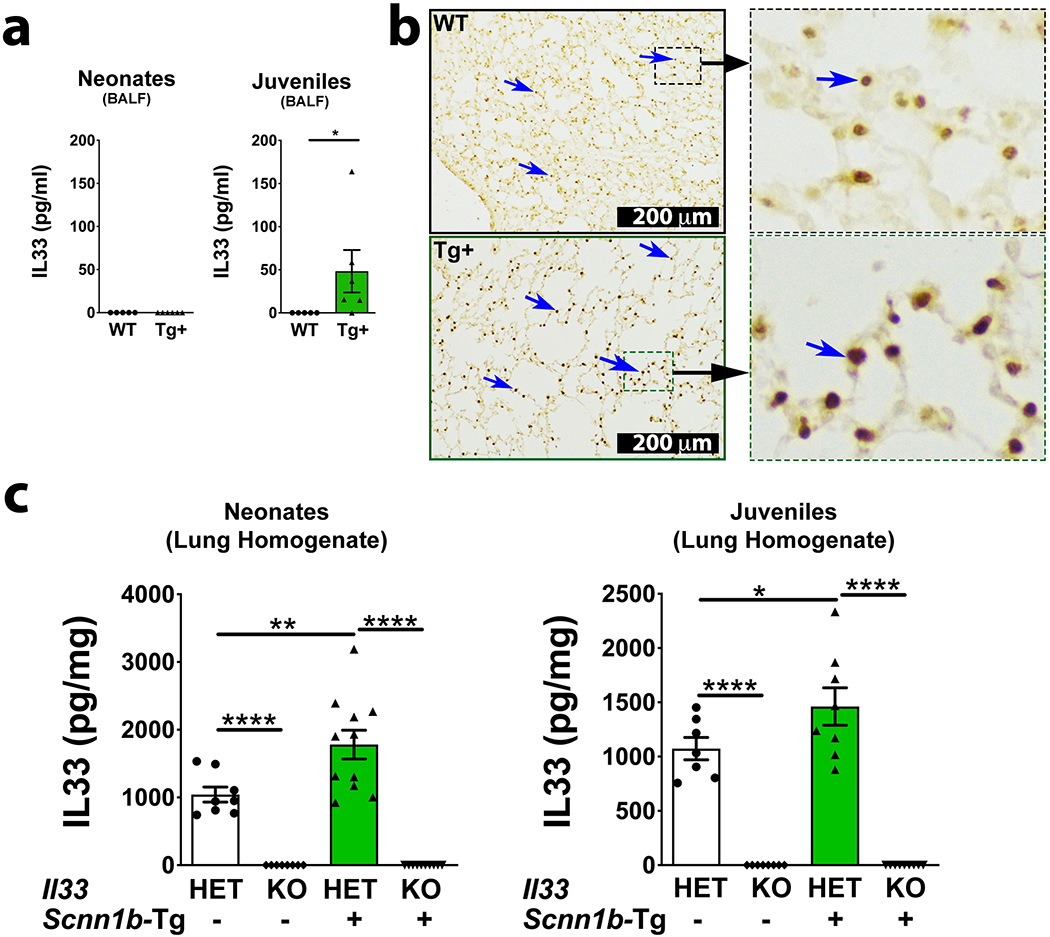
IL33 concentration in cell-free BALF from WT (white bar) and Scnn1b-Tg+ (green bar) neonates (a, left panel) and juveniles (a, right panel) (n=5–6 per group). For IL33 estimation in BALF, since equal volumes of BALF samples were used, the estimated IL33 values (picograms per milliliter, pg/ml) were used directly. Error bars represent SEM. *p<0.05, using Student’s t test. Representative photomicrographs from lung sections showing immuno-localization for IL33 protein (blue arrows) in WT [b, top left and top right (higher magnification)] and Scnn1b-Tg+ (bottom) juveniles [b, bottom left and bottom right (higher magnification)]. IL33 concentration (picogram per milligram; pg/mg) in lung homogenates from WT (white bar) and Scnn1b-Tg+ (green bar) neonates (c, left) and juveniles (c, right) (n=8–11 per group). The estimated IL33 values were normalized to the total lung homogenate protein content. Error bars represent SEM. *p<0.05, **p<0.01, ****p<0.0001 using ANOVA followed by Tukey’s multiple comparison post hoc test.