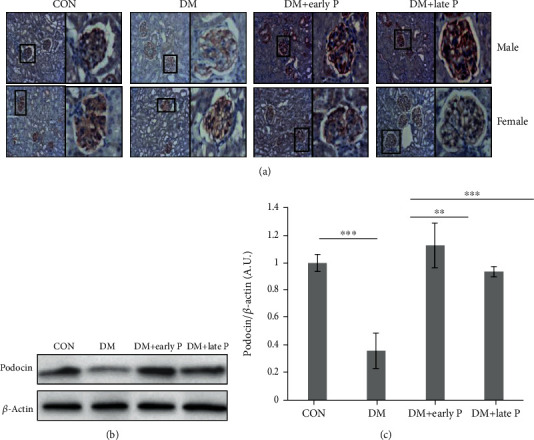
Figure 6.

Immunohistochemical analysis of podocin expression in mouse renal tissues. (a) Immunohistochemical (IHC) analysis of podocin expression in mouse kidney sections. Podocin staining was lower in DM as compared to control (CON) mice, while both early and late paricalcitol treatments restored podocin levels. Magnification, ×20. (b) Representative western blots of podocin and β-actin proteins extracted from mouse renal tissues. (c) Quantification of total western blots. Renal podocin levels were significantly lower in DM (n = 14) as compared to control mice (n = 11) (∗∗∗p < 0.001). A significant increase in podocin levels was observed in paricalcitol-treated (DM+early P (n = 10), DM+late P (n = 9) treatments) as compared to DM mice (∗∗p < 0.01, ∗∗∗p < 0.001, respectively). Error bars correspond to SEM.
