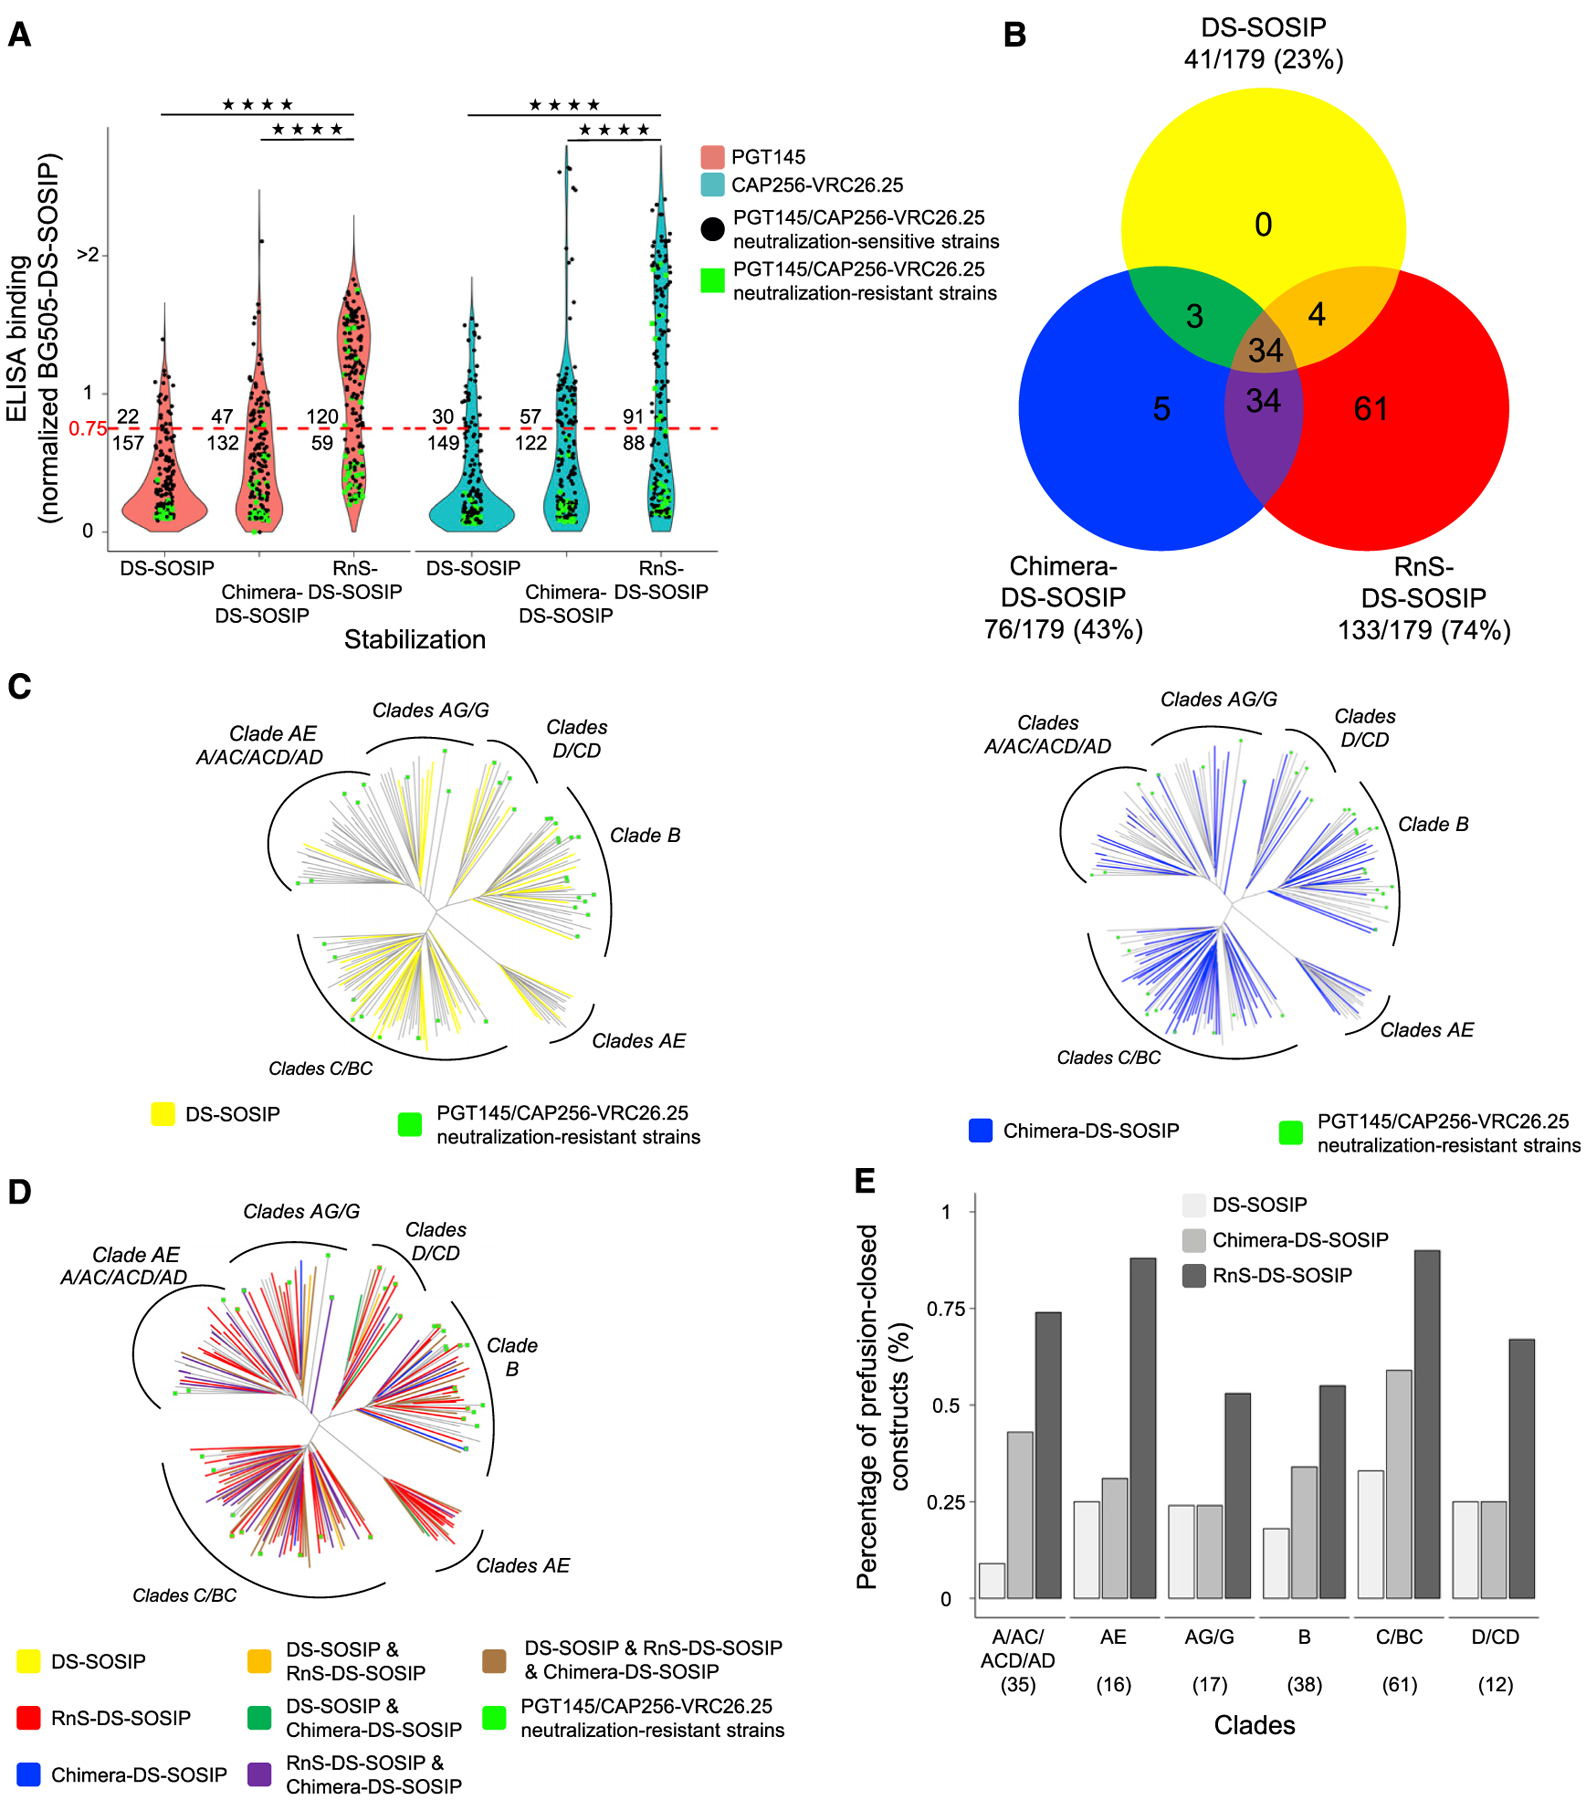
Figure 5. Antigenic Screening Yields 133 RnS-DS-SOSIP Prefusion-Closed Env Constructs Compared with 41 and 76 for DS-SOSIP and Chimera-DS-SOSIP.

(A) Binding response toward PGT145 and CAP256-VRC26.25, relative to BG505 DS-SOSIP, for DS-SOSIP, Chimera-DS-SOSIP, and RnS-DS-SOSIP of 179 strains, including 36 PGT145 and CAP256-VRC26.25 neutralization-resistant strains. Dotted red line indicates 75% binding response relative to BG505 DS-SOSIP. The values displayed at the top of the graph indicate the number of Env molecules with binding response at least 75% that of BG505 DS-SOSIP Env. Statistical significance was assessed using the two-tailed Mann-Whitney test (****p < 0.0001).
(B) Venn diagram depicting the amount of strains stabilized in prefusion-closed form by either DS-SOSIP, Chimera-DS-SOSIP, or RnS-DS-SOSIP.
(C) Phylogenetic trees of Envs from 179 strains, with those that can be stabilized by DS-SOSIP (left) and Chimera-DS-SOSIP (right) highlighted.
(D) Phylogenetic tree of Envs from 179 strains, with those that can be stabilized by DS-SOSIP, Chimera-DS-SOSIP, and/or RnS-DS-SOSIP highlighted on the basis of the coloring scheme in (B).
(E) Bar plot highlighting the percentage of strains that can be stabilized in prefusion-closed conformation by DS-SOSIP, Chimera-DS-SOSIP, or RnS-DS-SOSIP. Number of strains per clade is depicted in parentheses.
