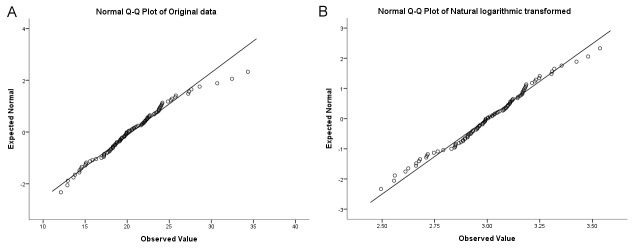
Fig. 1.
Quartile-Quartile plot (Q-Q plot) of original data and logarithmically transformed data. (A) Q-Q plot of original data. Upper tail of the plot seems to be going off from the straight line. This means that data has a probability of non-normal distribution. Mean and SD of this data is 20.52 and 4.117. The skewness of this distribution is 0.56, and it is a positively skewed distribution. Shapiro-Wilk normality test statistics = 0.974, P = 0.047. (B) Q-Q plot of natural logarithmic transformed data. Non-normality of data distribution seems to be improved in the part of the upper tail. Mean and SD of transformed data is 3.0 and 0.201. Skewness of transformed data is -0.14, Shapiro-Wilk normality test statistics = 0.988, P = 0.477.

