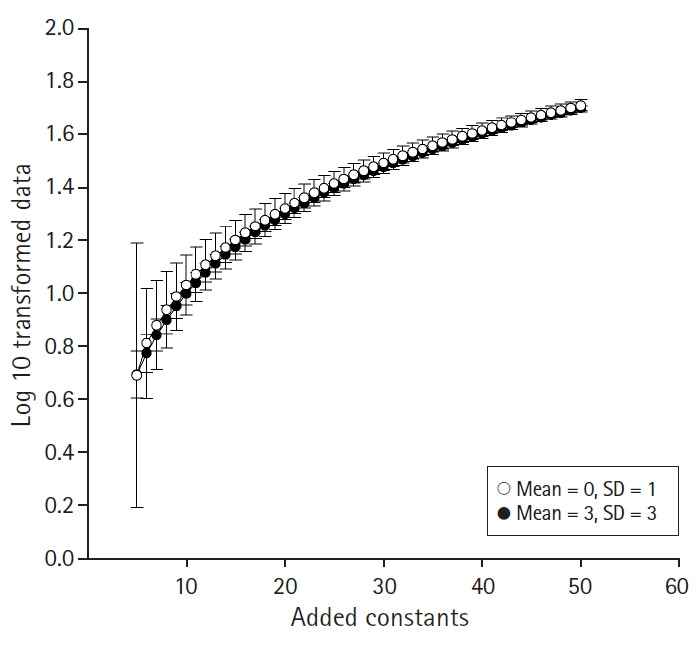
Fig. 3.

Mean and standard deviation changes according to the added constant before logarithmic transformation. Mean differences and SD of each group becomes smaller as the added constant increases. The original data randomly created with mean = 0, SD =1 (white dot) and mean = 1, SD = 3 (black dot), each of them has 100 cases.
