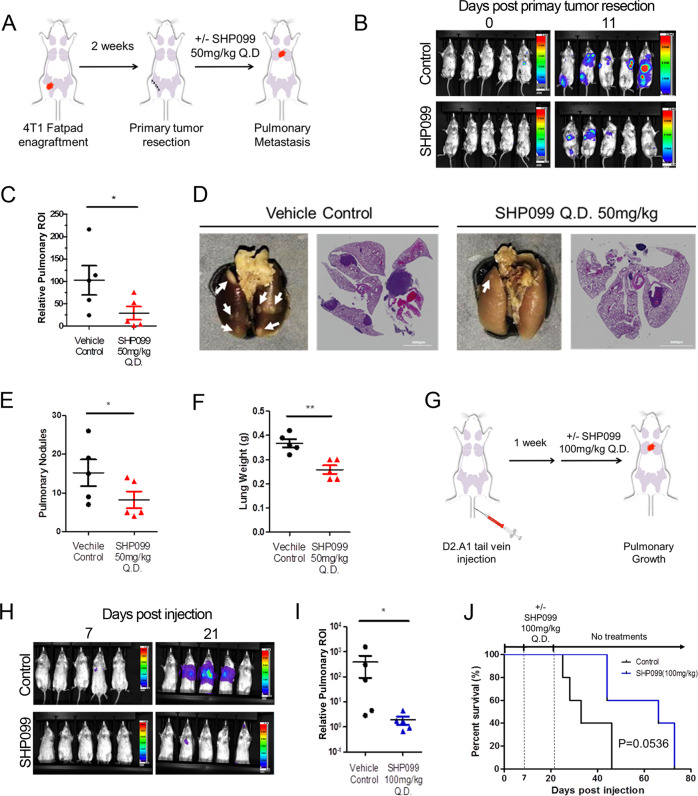
Fig. 2. Pharmacological inhibition of SHP2 blocks in vivo pulmonary metastasis.
a Schematic representation of the 4T1 post-surgical model of metastasis. b Representative bioluminescent images taken at Day 0 and Day 11 of SHP099 treatment. c Bioluminescent values of pulmonary regions of interest (ROI) were quantified as a measure of metastasis. Data are the ratio of luminescence values at Day 11 of treatment compared to Day 0. (*p < 0.05 for n = 5 mice per group). d Representative photos of pulmonary metastases (arrow heads) and H&E staining of pulmonary histological sections in control and SHP099 treated mice. e, f Plots comparing numbers of pulmonary nodules and lung weights from control and SHP099 treated mice (*p < 0.05, **p < 0.01, n = 5 mice per group). g Schematic of the D2.A1 model of pulmonary tumor growth. h Representative images of pulmonary growth monitored by bioluminescence at Day 7 and Day 21 post injection. i Bioluminescent values from pulmonary ROI quantified as the ratio of day 21 to day 7 following tumor cell injection (*p < 0.05, n = 5 mice per group). j Kaplan–Meier analyses of control and SHP099 treated mice, bearing D2.A1 pulmonary tumors, resulting in the indicated p value (n = 5 mice per group).

