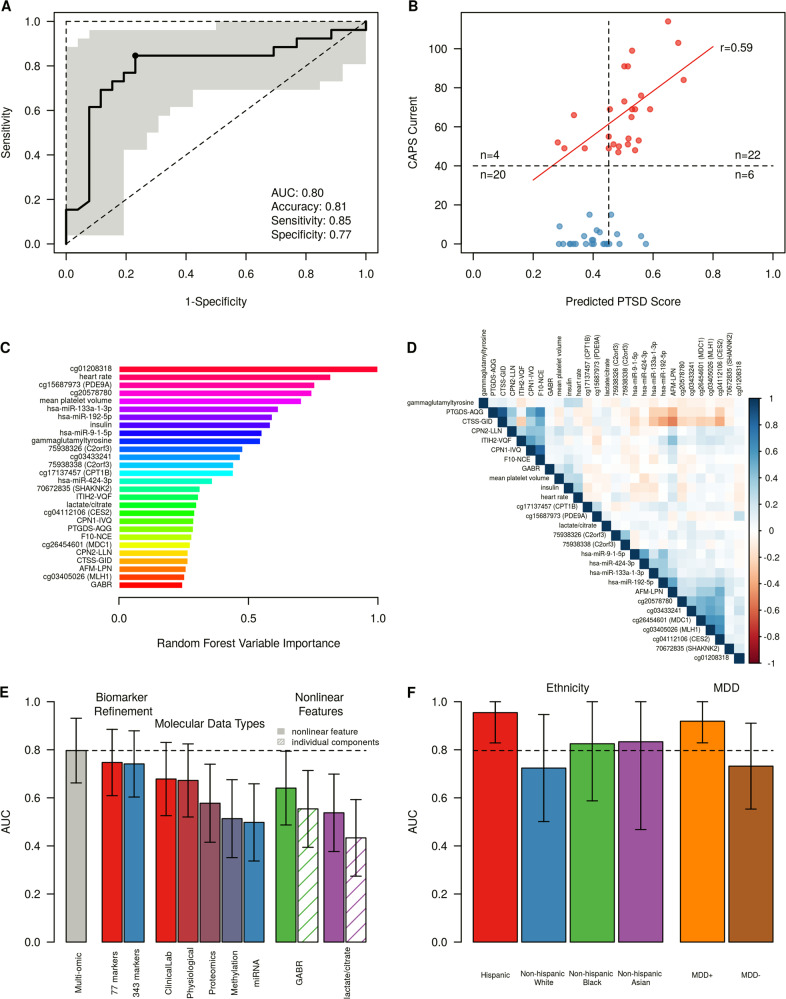
Fig. 3.
Validation of biomarker panels. a ROC curve for identified biomarker panel (28 markers), illustrating good performance in an independent validation dataset (26 cases, 26 controls). Shaded region indicates 95% confidence interval, determined by 2000 bootstrapping iterations. Operating point closest to (0,1) on ROC curve used for calculating sensitivity, specificity, and accuracy. b Predicted probability of PTSD based on trained random forest model using a biomarker panel of 28 features. In PTSD participants, predicted PTSD probability is correlated with PTSD symptom severity, measured by CAPS (r = 0.59, p < 0.01). c Random forest variable importance of the final 28 biomarkers. Variable importance was determined using biomarker model training data (cohorts 1 and 2). The top 10 biomarkers, based on random forest variable importance, contain multiple data types, including methylation markers (cg01208318, cg20578780, and cg15687973), physiological features (heart rate), miRNAs (miR-133a-1-3p, miR-192-5p, and miR-9-1-5p), clinical lab measurements (insulin and mean platelet volume), and metabolites (gammaglutamyltyrosine). d Correlation between PTSD biomarkers. Pearson correlation coefficients were computed in the combined set of all three cohorts. The final set of identified biomarkers show small clusters of moderately correlated features, primarily grouped by molecular data type (proteins, miRNAs, and methylation markers). e Biomarker panel performance evaluation during panel refinement, across molecular data types, and in nonlinear features. The validation AUC improves after biomarker down-selection and model refinement. The final biomarker panel validates with greater AUC over the initial biomarker candidate pool (343 markers, AUC = 0.74), and stage one refined panel (77 markers, AUC = 0.75). The final multi-omic panel also outperforms each individual molecular data type. Performance metrics for nonlinear feature combinations, Global Arginine Bioavailability Ratio (GABR) and lactate/citrate. Both nonlinear combinations outperform their individual components in AUC (0.60 vs. 0.51 and 0.55 vs. 0.52 in GABR and lactate/citrate, respectively). Error bars indicate 95% confidence interval, determined by 2000 bootstrapping iterations. f Validation performance by ethnicity, and in the presence of major depressive disorder (MDD). Validation performance in Hispanic participants was higher than other ethnicities (non-Hispanic White, non-Hispanic Black, non-Hispanic Asian). PTSD cases with comorbid MDD (n = 9) are easily distinguishable from all combat-exposed controls (n = 26), with AUC = 0.92, while PTSD cases without comorbid MDD (n = 17) are only moderately distinguishable from controls (n = 26), with AUC = 0.73

