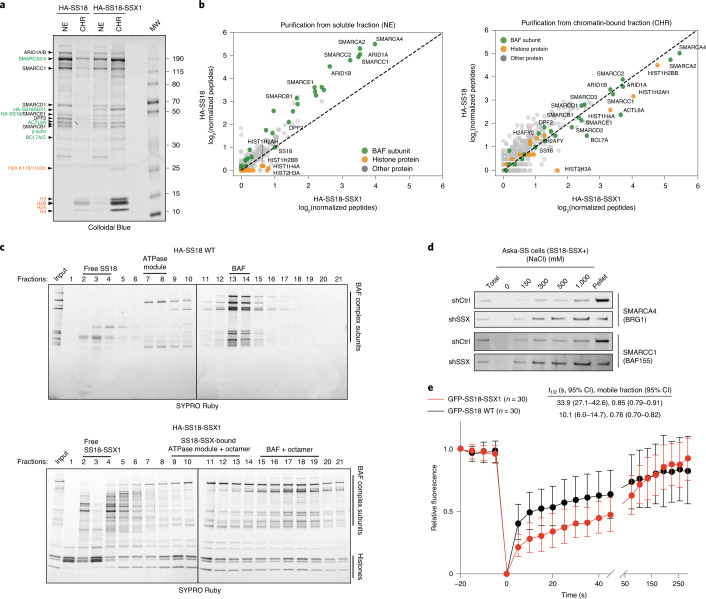
Fig. 1. SS18-SSX-containing BAF complexes exhibit increased affinity for chromatin.
a, Colloidal blue staining of WT BAF complexes (from HA-SS18 WT-expressing 293T cells) and SS18-SSX-contaning BAF complexes (from HA-SS18-SSX1-expressing cells), purified from soluble NE and CHR fractions. Equal amounts (by volume) of nuclei were fractionated, as described in the Methods. BAF complex subunits (black, with ATPase module components highlighted in green) and histone proteins (orange) are identified at left. b, MS spectral counts for BAF complex subunits (green) and histone proteins (orange) from HA-SS18 WT and HA-SS18-SSX purifications in a. Peptide counts are log2-normalized to bait (SS18 peptides). c, SDS–polyacrylamide gel electrophoresis (SDS–PAGE) of 10–30% glycerol gradient sedimentation performed on purified HA-SS18 WT (from NE) and HA-SS18-SSX1 (from CHR) fractions from HEK293T cells. BAF complex subunits and histone proteins are indicated. SYPRO Ruby staining was used for visualization. d, Immunoblot of SMARCA4 and SMARCC1 performed on Aska SS cells in shCtrl (control, non-targeting hairpin shRNA) and shSSX (shRNA targeted to SSX) conditions following differential salt extraction (0–1,000 mM NaCl). e, FRAP studies performed on HEK293T cells expressing either GFP-SS18 WT or GFP-SS18-SSX1. Recovery kinetics were recorded and the recovery half times were 10.1 and 33.9 s for GFP-SS18 WT and GFP-SS18-SSX1, respectively. Values represent mean ± s.d. of n = 30 cells per condition collected from two biological replicates. t1/2, 95% confidence interval (CI) and mobile fraction values were determined by fitting a curve to the data using nonlinear regression. Data for a and b are presented in Supplementary Table 1. Uncropped gel images for a, c and d are presented in Supplementary Fig. 1 and are available as Source data. Raw binding data for e are available as Source data.

