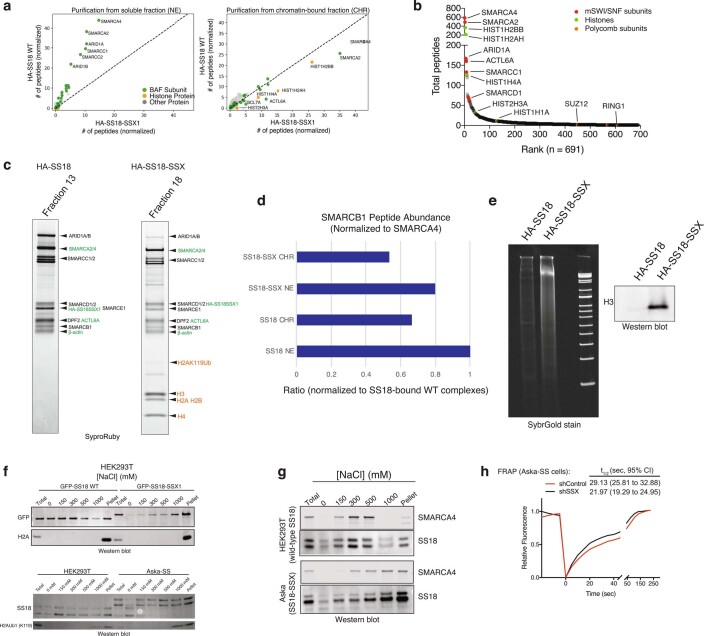
Extended Data Fig. 1. SS18-SSX-containing BAF complexes exhibit high-affinity interactions with histones and longer residency times on chromatin.
a, MS spectral counts for BAF complex subunits and histone proteins from HA-SS18 WT and HA-SS18-SSX purifications from soluble nuclear extract NE and CHR fractions from Fig. 1a. Total number of peptides (normalized to bait, SS18), are shown. b, Ranked peptides captured in HA-SS18-SSX purification (chromatin-bound fraction). Red, mSWI/SNF complex subunits. Green, histones. Orange, members of PRC1 and PRC2 complexes, shown for comparison. See also Supplementary Table 1. c, SYPRO Ruby staining indicating identified proteins from Fig.1c in Fraction 13 (HA-SS18 WT) and Fraction 18 (HA-SS18-SSX).d, SMARCB1 peptide abundance (normalized to SMARCA4) and relative to SS18 WT-bound complexes (soluble NE fraction). NE, nuclear extract; CHR, chromatin-bound fraction. e, (left) Cyber-gold staining of complexes purified from untreated (no benzonase) nuclear extracts isolated via ammonium sulfate extraction. (right) H3 immunoblot reveals prominent histone binding in HA-SS18-SSX-bound complexes but not in HA-SS18 WT-bound complexes. f, (Top) Immunoblot for GFP and H2A performed on HEK293T cells infected with either GFP-SS18 WT or GFP-SS18-SSX following differential salt extraction (0-1000 mM NaCl).(Bottom) Immunoblot for SS18 and H2AK119Ub performed on HEK293T cells (naive) and Aska-SS cells following differential salt extraction (0-1000 mM NaCl) experiments. g, Immunoblot for SMARCA4 and SS18 performed HEK293T cells or Aska SS cells (SS18-SSX + ) following differential salt extraction (0-1000 mM NaCl). h, FRAP experiments performed in the Aska SS cell line modified to express BRG1 (SMARCA4)-Halo. Aska-SS cells were treated witih either shControl shRNA hairpin or shSSX (targeting the SS18-SSX fusion). Values represent mean of n = 30 cells per condition collected from two biological replicates and t1/2 and 95% CI values were determined by fitting a curve to the data using nonlinear regression. Uncropped gel images for all relevant panels are presented in Supplementary Figure 1. Data for panels 1d, 1e, and 1 h are available as source data.

