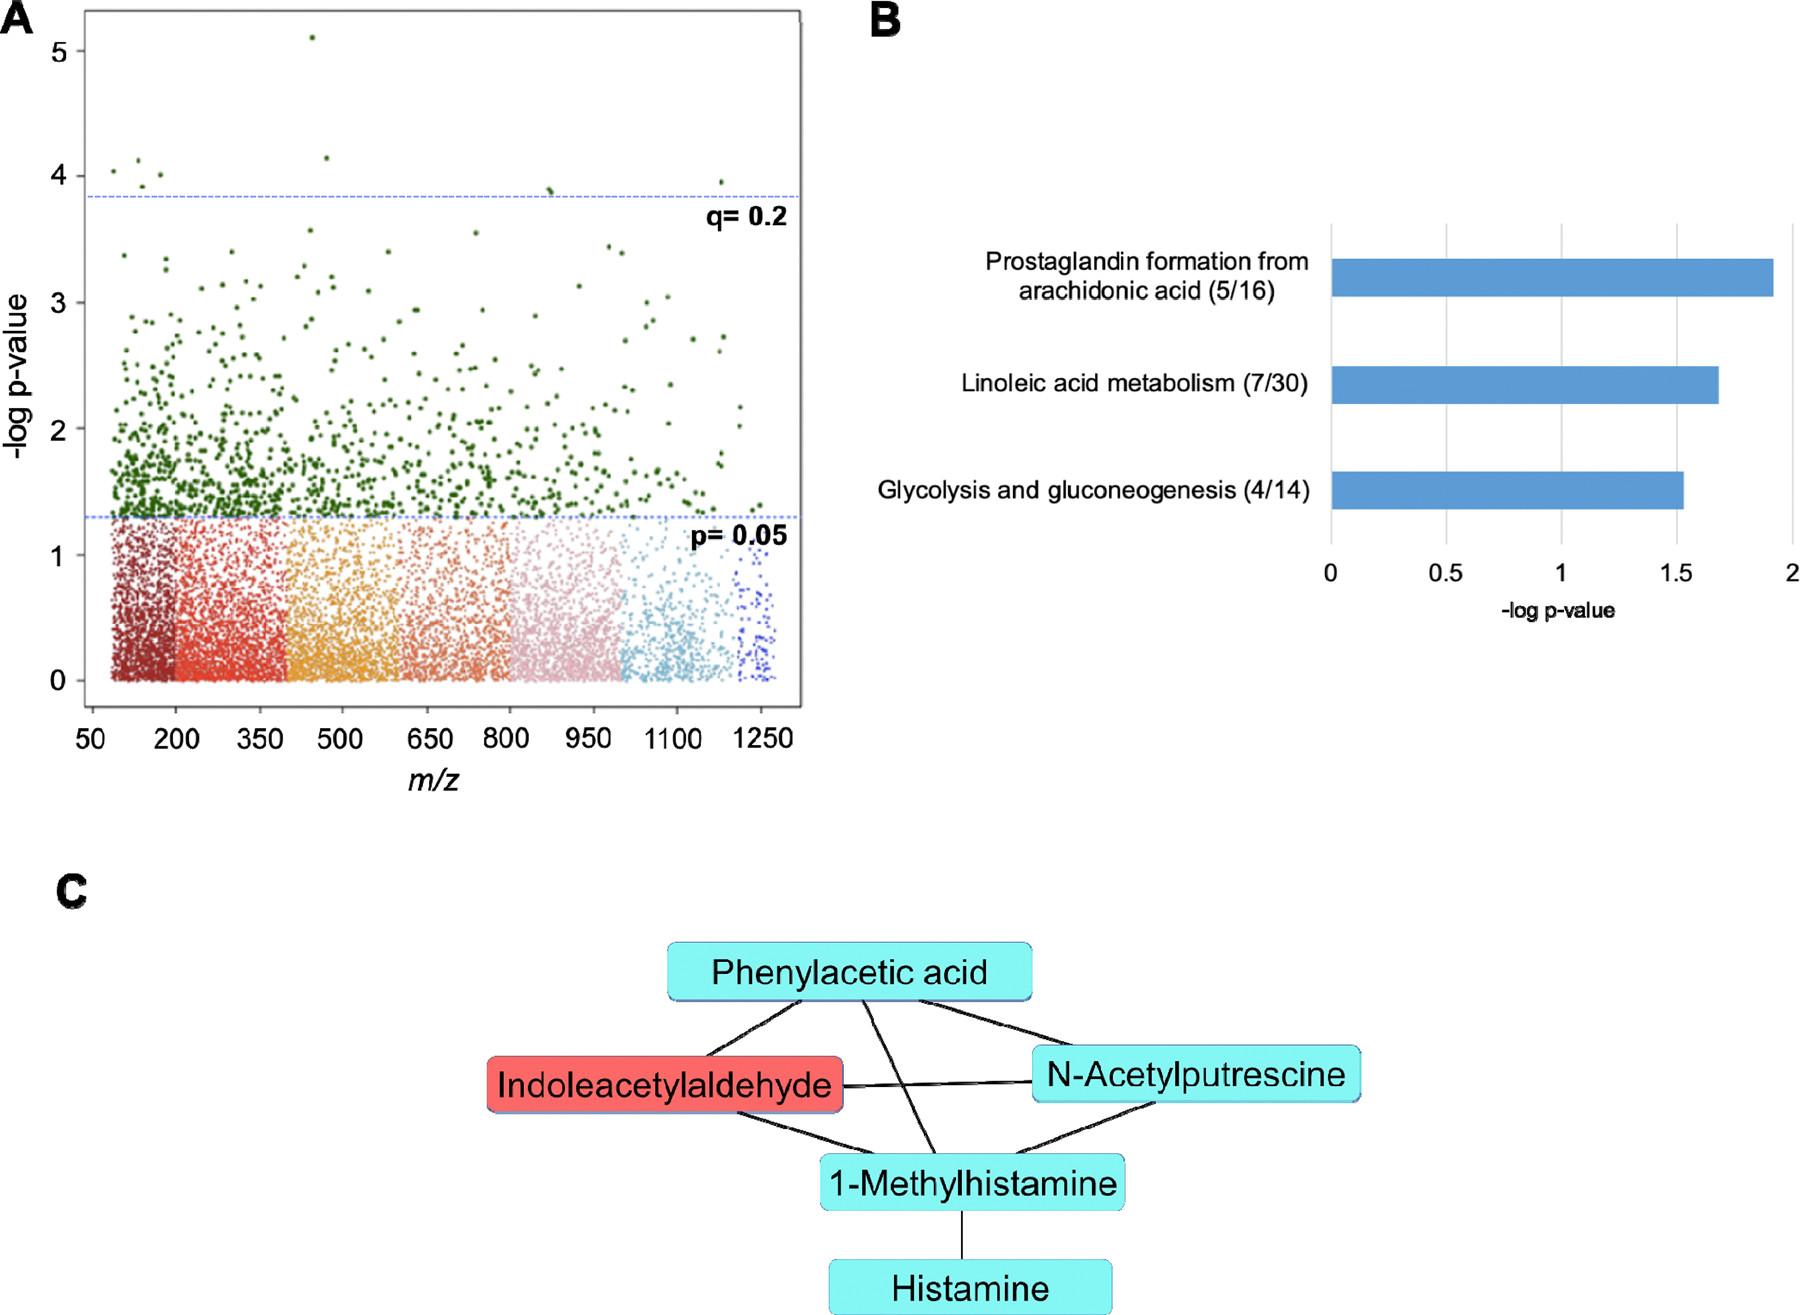
Figure 3.

A) Manhattan plot denoting 970 significant metabolic features at p<0.05, and nine metabolic features significant at q<0.2. B) Significantly enriched metabolic pathways associated with spine BMD. Significant metabolites over total pathway metabolites detected are shown in parentheses. C) Module analysis of the relationship between metabolites significantly associated with spine BMD, where blue metabolites are inversely associated and red metabolites are positively associated with spine BMD, respectively. All metabolites included in the module are annotated with an MSI level 1 or 2 confidence.
