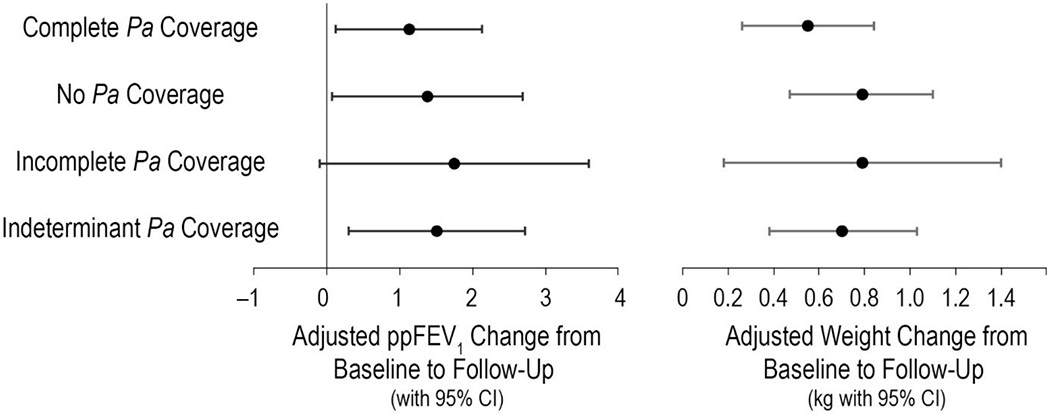
Figure 3. Baseline to follow-up changes in ppFEV1 and weight by Pa coverage category.

Left panel, mean ppFEV1 changes by coverage category. Right panel, mean weight changes in kg by coverage category. Means were derived from general estimating equations (GEE) to account for repeated measures, with adjustment for prior-year PEx treatment number, baseline ppFEV1, age, sex, treatment duration, IV antipseudomonal administration, beta-lactam/aminoglycoside co-administration, antifungal administration, time from AST test to treatment start, and BMI. Bars are 95% confidence intervals (CI).
